Inside VSTS
Static Code Analysis Configuration
Mickey Gousset shows you the different static code analysis configuration options in Visual Studio 2010.
In our previous column on code analysis, we discussed what code analysis is and why you want to use it. We also provided a simple example of running code analysis. This column builds off the previous column, by examining all the different options for configuring code analysis in Visual Studio 2010. By making use of the configuration options, you have the ability to fine-tune the code analysis engine to perform exactly how you want it to.
Static Code Analysis Settings
Static code analysis settings are defined at the project level. To access the static code analysis settings for a project in Visual Studio 2010, right-click on the project in Solution Explorer and select Properties from the context menu. You can also select the Project main menu option in Visual Studio, then select Properties, where is the name of your project. Either option opens the same window, the Project Properties window for the Visual Studio project.
The project properties window contains a number of tabs on the left-hand side for configuring different project properties. The last tab in the window is the Code Analysis tab. Select the Code Analysis tab to begin configuring how we want code analysis to work with this project. Figure 1 shows the layout for the Code Analysis tab.
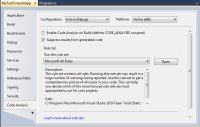
[Click on image for larger view.] |
| Figure 1. Code analysis options for the Visual Studio project. |
You can configure different code analysis options for your project, depending on its configuration and the platform for which you are building. At the top of the code analysis window are two drop down list boxes: Configuration and Platform. Configuration contains a list of the different potential configurations, including Debug, Release, and All Configurations. Platform contains a list of the different platforms for which the code may be compiled, including x86 and x64. Each combination of Configuration and Platform can have its own code analysis configuration.
Beneath the two drop down list boxes are two checkboxes. When the Enable Code Analysis on Build checkbox is checked, code analysis will run anytime the code is compiled. So every time the developer presses F5 in Visual Studio to compile and run his code, code analysis will run as part of the build process. By default, this checkbox is disabled. The other check box, Suppress results from generated code, tells the code analysis engine to ignore any code that was automatically generated by Visual Studio. In theory, any auto-generated code should be optimized, so running code analysis against it would be redundant.
The final section of the code analysis property tab deals with rule sets. We explained the concept of rule sets in the previous column. In basic terms, you can think of rule sets as a super-grouping of static code analysis rules. Out of the box, Visual Studio 2010 ships with eight different rule sets:
| Rule Set Name |
Rule Set Description |
| Microsoft All Rules |
This rule set contains every code analysis rule |
| Microsoft Basic Correctness Rules |
This rule set focuses on logic errors and common
mistakes made when using the framework APIs |
| Microsoft Basic Design Guideline Rules |
This rule set focuses on enforcing best practices to
make your code easy to understand and use |
| Microsoft Extended Correctness Rules |
This rule set expands on the Basic Correctness Rules
rule set to
maximize the logic and framework usage errors that are discovered |
| Microsoft Extended Design Guideline Rules |
This rule set expands on
the Basic Design Guideline Rules rule set to maximize the usability and
maintainability issues that are discovered |
| Microsoft Globalization Rules |
This rule set focuses on problems that
prevent application data from displaying correctly when used in
different languages, locales, and cultures |
| Microsoft Minimum
Recommended Rules |
This rule set focuses on critical code problems,
including potential security holes, application crashes, and other
important logic and design errors. |
| Microsoft Security Rules |
This rule set contains all the Microsoft security rules |
Using the drop down list box, you can select the rule set that you want to apply to a particular configuration, such as Debug x86, or Release x64.
If we select the Microsoft All Rules rule set, and click the Open button, we can see detailed information on all the rules included in this rule set as shown in Figure 2.
As you can see in Figure 2, individual static code analysis rules are divided into groups. Each group is comprised of one or more code analysis rules. In Figure 2, we have expanded the Microsoft.Maintainability group to show some of the rules contained in the group. You have the ability to turn rules and groups off and on by simply checking or unchecking the appropriate checkboxes. You can also control the action that occurs when a code analysis rule finds a potential issue. By default, a warning is thrown. But you may want specific rules or rule groups to throw an error instead of a warning. Or you may not want a particular rule to trigger any sort of action. To customize the action, simply click in the Action column of the rule or rule group that you want to change. A drop down list box will appear giving you the option to select Error, Warning, or None.
There are also multiple navigation options in this window. You can group the information in different ways, view rules with specific actions and search through the rule set. All these features are designed to make it easy to create your own custom rule sets. To create a custom rule set, open an existing rule set, such as the Microsoft All Rules rule set. Modify the rule set as needed, disabling rules and changing actions as appropriate. When you are done, select File->Save to save the rule set. You will be prompted to save your custom ruleset to a file named .ruleset as shown in Figure 3.
To use this custom rule set, you need to go back to the Code Analysis tab on the project properties window, and select from the Rules drop down list box. Select the rule set file you created previously. At this point, you will be able to continue making modifications to the rule set.
Observant readers will notice that to use the custom code analysis rule set, we have to have access to the rule set file. That means all team members will have to have access to the file. Some consideration must be given on how to provide this access. Potential solutions include storing the file on a file share accessible by the team or pushing the file out with System Center Configuration Manager. If you are using Microsoft Team Foundation Server 2010 for your version control system, you might also consider storing the custom rule set as another file in your Visual Studio project. Then, when team members access the code in the version control system, they will have access to the custom rule set file as well.
Conclusion
In this column we have looked at the different ways the code analysis engine in Visual Studio 2010 can be configured. Enabling different rule sets depending on the build configuration, as well as the ability to create custom rule sets, enhances the usefulness of the code analysis toolset.
About the Author
Mickey Gousset spends his days as a principal consultant for Infront Consulting Group. Gousset is lead author of "Professional Application Lifecycle Management with Visual Studio 2012" (Wrox, 2012) and frequents the speaker circuit singing the praises of ALM and DevOps. He also blogs at ALM Rocks!. Gousset is one of the original Team System/ALM MVPs and has held the award since 2005.