Product Reviews
Visualizing BI with Infragistics NetAdvantage for Silverlight Data Visualization
The controls in the Infragistics Data Visualization package are cool. But you'll need to work through the sample applications to take advantage of them.
The Infragistics Data Visualization bundle includes a wide variety of controls for converting data into visual displays: two kinds of graphs covering every format I know of, two charts (one targeted for static data and another for handling live data streams), a configurable gauge control, a pivot grid, a map, a timeline and a tree map. To use these controls you'll need Silverlight 4 (Visual Studio 2010 comes with Silverlight 3), and you must ensure your users have (or can get) the Silverlight 4 runtime.
You shouldn't mistake this for a complete business intelligence (BI) solution. As Infragistics says: "You supply the business intelligence." The Infragistics bundle supplies the controls to display the data. You'll still need tools to slice, dice and aggregate your data before feeding it to these controls.
As a test of the product's capabilities, I used the xamTimeline to display a sequence of orders by date. It's a powerful tool: I probably spent more time developing the Web service to deliver the data and playing with the layout than I did getting the actual graph working. For another sample application, I created a mapping app using the xamMap control. The control depends on ShapeFiles to provide its mapping coordinates, which aren't included (I retrieved a set for the United States from census.gov by following a link in the Help file). Again, I probably spent more time setting up my supporting code than getting the initial display from the control.
Also included in the package are the Infragistics Drag-and-Drop Framework and Excel Engine. The Drag-and-Drop Framework, among other uses, supports creating configurable dashboards, while the Excel Engine facilitates importing (or exporting) data from Excel workbooks. I took a look at the Windows Presentation Foundation (WPF) package and had a hard time telling the difference between it and the Silverlight package I tested.
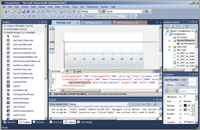
[Click on image for larger view.] |
| Figure 1. Using the Data Visualization Controls. The controls integrate smoothly with Visual Studio and can be used like any other Silverlight control. |
What kept me from thoroughly liking this package was the documentation. The basic package's "Documentation" link leads to three short paragraphs on the package -- you wonder why it was included at all. Downloading the Help package adds another link that points to actual documentation (though the list of topics includes the unhelpful entry "Root title -- rename this"). The documentation was missing what I considered important information (the apparently critical DataMapping property on the xamTimeline is barely discussed) and included both typos ("Data Time" for "Date Time") and sample code with errors.
The xamDataChart supports the Infragistics Motion Framework, but the explanation of the Motion Framework told me that I had to experience it to understand it. A link sent me to a sample application that I never did figure out -- and I never understood how the Motion Framework contributed to it. Your best bet is to use the documentation to orient yourself to the toolset and then use the sample apps to understand how to exploit the controls.
The selection of controls in the bundle is interesting. The xamWebChart, for instance, is also included in the standard Infragistics Silverlight bundle (as are the Drag-and-Drop Framework and Excel Engine). The xamBarcodes look good, but I didn't see their purpose in a BI project. The controls have built-in localization, but only for Germany.
However, the controls are cool and did everything I asked them to do. But figuring out what I could get the controls to do and how to get them to do it was more problematic. For me, this is a product that needs more time spent on its infrastructure. If I were building a BI-driven application, I'd want to come back to this in a few months to see how the support improved.
NetAdvantage for Silverlight Data Visualization
Infragistics Inc.
Web: infragistics.com
Phone: 800-231-8588
Price: $995.00
Quick Facts: The tools you need to create rich UIs for business intelligence applications
Pros: Some cool controls that make it easy to create sophisticated data displays
Cons: You're going to have to lean on the sample applications to get the full benefit of the controls -- documentation isn't sufficient
About the Author
Peter Vogel is a system architect and principal in PH&V Information Services. PH&V provides full-stack consulting from UX design through object modeling to database design. Peter tweets about his VSM columns with the hashtag #vogelarticles. His blog posts on user experience design can be found at http://blog.learningtree.com/tag/ui/.