In-Depth
Data Clustering Using Entropy Minimization
Entropy Minimization is a new clustering algorithm that works with both categorical and numeric data, and scales well to extremely large data sets.
Data clustering is the process of placing data items into different groups (clusters) in such a way that items in a particular group are similar to each other and items in different groups are different from each other. Clustering is a machine-learning technique that has many important practical uses. For example, cluster analysis can be used to determine what types of items are often purchased together so that targeted advertising can be aimed at consumers, or to group events in a log file to analyze the behavior of a software system.
There are many different clustering algorithms because the effectiveness of a particular algorithm depends on the characteristics of the data being clustered. The most basic algorithm is called k-means clustering. Unfortunately, k-means clustering directly applies only in situations where the data items to be clustered are completely numeric. In this article I present a clustering algorithm that's based on a concept called entropy. The algorithm works with categorical and numeric data and scales well to extremely large data sets. Although all the ideas used in the clustering algorithm presented here are known, the overall algorithm and specific implementation, to the best of my knowledge, have not been published before. I call this algorithm and its implementation Entropy Minimization Iterative Agglomerate Clustering (EMIAC) to distinguish it from other clustering techniques.
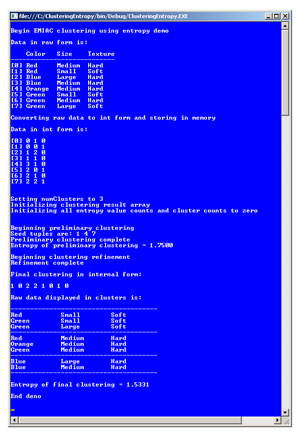
The best way to understand what clustering is and see where I'm headed in this article is to take a look at Figure 1. The demo program shown in the figure is clustering a small set of eight dummy data items. Each tuple has three categorical attributes: color, size and texture. Color can take on one of four possible values: red, blue, green or orange. Size can be small, medium or large. Texture can be hard or soft.
The demo program converts the raw string data into integer form for more-efficient processing. For color, red, blue, green and orange are encoded as 0, 1, 2 and 3, respectively. For size, small, medium and large are encoded as 0, 1, 2, respectively. For texture, hard is encoded as 0 and soft is encoded as 1. So the first raw data item, "Red Medium Hard," is encoded as "0 1 0."
Many clustering algorithms, including EMIAC, require the number of clusters to be specified. In this case the number of clusters is set to 3. The demo program then uses EMIAC to find the best clustering of the data. Behind the scenes, the algorithm starts by placing seed tuples 1, 4 and 7 into clusters 0, 1 and 2, respectively. Then the clustering algorithm iterates through the tuples, assigning each tuple to the cluster that generates the best overall clustering, based on entropy. Because clustering doesn't use any kind of training data, clustering is called "unsupervised learning." After a preliminary clustering pass, the EMIAC algorithm performs a refining pass to try and improve the clustering.
Internally, the demo program encodes a clustering as an array of int. The index of the array indicates a tuple index, and the cell value in the array indicates a cluster. In Figure 1, the final clustering obtained by the algorithm is [1,0,2,2,1,0,1,0], which means tuple 0 ("Red Medium Hard") is in cluster 1, tuple 1 ("Red Small Soft") is in cluster 0, tuple 2 ("Blue Large Hard") is in cluster 2 and so on. The demo program displays the final, best clustering found in string format for readability, and also displays a key metric called the entropy of the best clustering, 1.5331 in this example.
 [Click on image for larger view.]
Figure 1. Clustering using entropy minimization.
[Click on image for larger view.]
Figure 1. Clustering using entropy minimization.
This article assumes you have advanced programming skills with a C-family language but doesn't assume you know anything about data clustering. I coded the demo program using a non-OOP approach with the C# language, but you shouldn't have too much trouble refactoring the demo code to OOP or another language. I've removed all normal error-checking for clarity. The demo program code is too long to present in its entirety in this article, so I'll focus on the EMIAC algorithm so that you'll be able to modify the demo code to meet your own needs. You can download the complete source code for the demo program here [ref: hyperlink to code download].
Entropy
Data clustering involves solving two main problems. The first problem is defining exactly what makes a good clustering of data. The second problem is determining an effective technique to search through all possible combinations of clustering to find the best clustering. Entropy addresses the first problem. Entropy is a metric that's a measure of the amount of disorder in a vector. There are several variations of entropy. The most common is called Shannon's entropy. Expressed mathematically, Shannon's entropy is:
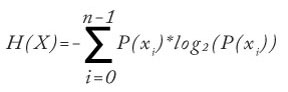
Here H is the symbol for entropy. X is a vector of zero-indexed symbols, and P means "probability of." The log2 function (log to base 2) assumes that log2(0) = 0.0 rather than the true value of negative infinity. Entropy is best explained by example. Suppose you have a vector = { red, red, blue, green, green, green }. Then x0 = red, x1 = blue and x2 = green. The probability of red is P(x0) = 2/6 = 0.33. Similarly, P(x1) = 1/6 = 0.17 and P(x2) = 3/6 = 0.50. Putting these values in the equation gives:
H(x) = - [ 0.33 * log2(0.33) + 0.17 * log (0.17) + 0.50 * log(0.50) ]
     = - [ (0.33 * -1.58) + (0.17 * -2.58) + (0.50 * -1.00) ]
     = - [ -0.53 + -0.43 + -0.50 ]
     = 1.46
The smallest possible value for entropy is 0.0, which occurs when all symbols in a vector are the same. In other words, there's no disorder in the vector. The larger the value of entropy, the more disorder there is in the associated vector.
The EMIAC algorithm uses entropy to define the goodness of a clustering. Smaller values of entropy indicate less disorder in a clustering, which means a better clustering. However, it's not obvious how to modify the definition of entropy (which applies to a single vector) to apply to a clustering (which is essentially a collection of tables or matrixes). Suppose the problem is to compute the overall entropy of the clustering shown in Figure 1, like so:
--------------------
Red     Small   Soft
Green   Small   Soft
Green   Large   Soft
--------------------
Red     Medium  Hard
Orange  Medium  Hard
Green   Medium  Hard
--------------------
Blue    Large   Hard
Blue    Medium  Hard
--------------------
Here there are three clusters, k = 0, k = 1 and k = 2. EMIAC defines the overall entropy of a clustering as the weighted sum of entropies for each cluster, where the entropy of a cluster is the sum of the entropies of each column. For k = 0, the three column entropies are:
Color:   H = - [ 1/3 * log2(1/3) + 2/3 * log2(2/3) ]
           = 0.92

Size:    H = - [ 2/3 * log2(2/3) + 1/3 * log2(1/3) ]
           = 0.92

Texture: H = - [ 3/3 * log2(3/3) ]
           = 0.00
And so the entropy for cluster k = 0 is 0.92 + 0.92 + 0.00 = 1.84. Similarly, the entropy for cluster k = 1 is 1.59 + 0.00 + 0.00 = 1.59. And the entropy for cluster k = 2 is 0.00 + 1.00 + 0.00 = 1.00.
Now the overall entropy for the clustering is the weighted sum of the cluster entropies, where the weight for each cluster is the probability of the cluster, which is just the number of tuples in the cluster divided by the total number of tuples. So, P(cluster 0) = 3/8 = 0.375, P(cluster 1) = 3/8 = 0.375 and P(cluster 2) = 2/8 = 0.250. Putting the individual cluster entropies and their weights together gives the overall EMIAC entropy of the clustering:
E = (1.84)(0.375) + (1.59)(0.375) + (1.00)(0.250)
  = 0.688 + 0.595 + 0.250
  = 1.533
To summarize, standard entropy defines the amount of disorder in a vector. The EMIAC algorithm extends this idea to define the total amount of disorder in a clustering. Smaller values of overall entropy indicate less disorder, which indicates a better clustering.
Searching for the Best Clustering
After defining a way to measure clustering goodness, the second problem to solve in any clustering algorithm is to come up with a technique to search through all possible clusterings for the best clustering. Except for extremely small data sets, it's not feasible to examine every possible clustering. For example, for a data set with only 50 tuples and three clusters, there are 3^50 / 3! possible clusterings. Even if you could somehow examine 1 trillion clusterings per second, it would still take roughly 3,790 years to check every possible clustering.
Different clustering algorithms use different techniques to search through all possible clusterings. The EMIAC algorithm uses what's called a greedy agglomerative approach. The idea is to begin by seeding each cluster with a single tuple. Then for each remaining tuple, determine which cluster k', if the current tuple were added to it, would yield the best overall clustering as measured by entropy. Then the current tuple is actually assigned to cluster k'. Notice this technique doesn't guarantee that the optimal clustering will be found. The final clustering produced by the EMIAC algorithm depends on which tuples are selected as initial seed tuples, and the order in which the remaining tuples are assigned to clusters.
It turns out that selecting a seed tuple for each cluster isn't trivial. One naive approach would be to simply select random tuples as the seeds. However, if the seed tuples are similar to each other, then the final clustering will be poor. A better approach for selecting seed tuples is to select tuples that are as different as possible from each other. There are several ways to do this, as I'll explain shortly.
Key Data Structures
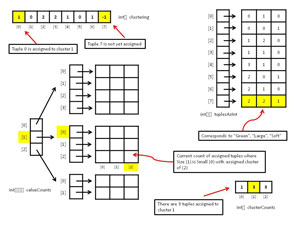
Although it's possible to compute the entropy of a clustering on the fly by iterating through each tuple in the data set, because the clustering method needs to compute entropy many times, a much better approach is to store the counts of attribute values of tuples that are assigned to clusters at any given point during the algorithm. Figure 2 shows most of the data structures used by the demo program. Array valueCounts is used to compute the entropies of each column of each cluster, which in turn are used to compute the overall entropy of a clustering. There's one value count for every combination of attribute value and cluster. So, for the demo, because there are nine attribute values (Red, Blue, ... Soft) and three clusters, there are 9 * 3 = 27 value counts. The first index in valueCounts indicates which attribute, the second index indicates which attribute value, and the third index indicates which cluster. For example, valueCounts[1][0][2] holds the count of assigned tuples where the size (1) is small (0) and assigned cluster is (2).
 [Click on image for larger view.]
Figure 2. Key data structures for entropy-based clustering.
[Click on image for larger view.]
Figure 2. Key data structures for entropy-based clustering.
Array clusterCounts holds the number of tuples that are currently assigned to each cluster. For example, if numClusters = 3 and clusterCounts = [1,3,3], then there's one tuple assigned to cluster 0, and three tuples assigned to clusters 1 and 2.
Array clustering encodes how tuples are assigned to clusters. The index of array clustering represents a tuple, and the cell value represents a cluster. For example, if clustering[0] = 2, then tuple 0 is assigned to cluster 2. Cell values of -1 indicate the associated tuple has not yet been assigned to a cluster.
Overall Program Structure
The Main method of demo program shown running in Figure 1, with some WriteLine statements and comments removed, is listed in Listing 1. I used Visual Studio 2010 with the Microsoft .NET Framework 4, but the demo code has no significant dependencies and any version of Visual Studio that supports the .NET Framework 2.0 or later should work fine. For simplicity I created a single C# console application named ClusteringEntropy. You might want to implement clustering as a class library.
Listing 1. Overall program structure.
using System;
using System.Collections.Generic;

namespace ClusteringEntropy
{
  class ClusteringEntropyProgram
  {

    static Random random = null;  // To generate seed tuples

    static void Main(string[] args)
    {
      try
      {
        Console.WriteLine("\nBegin EMIAC clustering using entropy demo\n");

        random = new Random(0);

        string[] attNames = new string[] { "Color", "Size", "Texture" };

        string[][] attValues = new string[attNames.Length][];
        attValues[0] = new string[] { "Red", "Blue", "Green", "Orange" }; // Color
        attValues[1] = new string[] { "Small", "Medium", "Large" }; // Size
        attValues[2] = new string[] { "Hard", "Soft" }; // Texture

        // real data likely in a text file or SQL table
        string[][] tuples = new string[8][];
        tuples[0] = new string[] { "Red", "Medium", "Hard" };
        tuples[1] = new string[] { "Red", "Small", "Soft" };
        tuples[2] = new string[] { "Blue", "Large", "Hard" };
        tuples[3] = new string[] { "Blue", "Medium", "Hard" };
        tuples[4] = new string[] { "Orange", "Medium", "Hard" };
        tuples[5] = new string[] { "Green", "Small", "Soft" };
        tuples[6] = new string[] { "Green", "Medium", "Hard" };
        tuples[7] = new string[] { "Green", "Large", "Soft" };

        ShowData(tuples, tuples.Length);

        Console.WriteLine("Converting raw data to int form and storing in memory\n");
        int[][] tuplesAsInt = TuplesToInts(tuples, attValues);
        ShowData(tuplesAsInt, tuplesAsInt.Length);

        int numClusters = 3;
        int numSeedTrials = 10;  // Times to iterate to get good seed tuples

        Console.WriteLine("Initializing clustering result array");
        int[] clustering = InitClustering(tuplesAsInt);

        Console.WriteLine("Initializing data structures\n");
        int[][][] valueCounts = InitValueCounts(tuplesAsInt, attValues,
          numClusters);
        int[] clusterCounts = new int[numClusters];

        Console.WriteLine("\nBeginning preliminary clustering");
        Cluster(tuplesAsInt, clustering, valueCounts, clusterCounts, numSeedTrials);
        Console.WriteLine("Preliminary clustering complete");
        double entropy = Entropy(valueCounts, clusterCounts);
        Console.WriteLine("Entropy of preliminary clustering = " +
          entropy.ToString("F4"));

        Refine(20, tuplesAsInt, clustering, valueCounts, clusterCounts);
        Console.WriteLine("Refinement complete");

        Console.WriteLine("\nFinal clustering in internal form:\n");
        ShowVector(clustering);

        ShowClusteredData(tuplesAsInt, numClusters, clustering, attValues);

        entropy = Entropy(valueCounts, clusterCounts);
        Console.WriteLine("\nEntropy of final clustering = " +
          entropy.ToString("F4"));

        Console.WriteLine("\nEnd deno\n");
      }
      catch (Exception ex)
      {
        Console.WriteLine(ex.Message);
      }
    } // Main

    static double LogBaseTwo(double x)
    {
      if (x <= 0.0) return 0.0;   // Log base 2 of 0.0 is -infinity
      else return Math.Log(x, 2);
    }

    // All other methods here

  } // Program class
} // ns
The Main method begins by instantiating a class-scope Random object that will be used to generate random candidate seed tuples to get the clustering process started. Next, the program sets up eight tuples of raw color-size-texture data. In realistic clustering scenarios, your raw data will likely be stored in a text file or SQL table. The demo program uses helper method TuplesToInts to generate an array of data stored as type int. In situations with very large data sets that won't fit into memory, you'll need to iterate through your external data rather than store it in memory.
Variable numClusters holds the number of clusters for the EMIAC algorithm. Variable numSeedTrials is used by method Cluster when selecting an initial tuple to seed into each cluster. Method cluster performs one iteration of the EMIAC algorithm by placing one tuple in each of the three clusters, then iterating through the remaining tuples, assigning each to the cluster that generates the lowest (best) overall clustering entropy. An alternative is to call method Cluster several times, starting with different seed tuples, and return the clustering that gives the lowest entropy.
After method Cluster has finished, the demo program calls method Refine in an attempt to improve the current clustering. Method Refine selects a random tuple and checks to see if moving the tuple to a different cluster improves the overall clustering.
Coding the Entropy Method
The code for the method that computes overall clustering entropy is not conceptually difficult, but it's a bit tricky. The method's definition begins:
static double Entropy(int[][][] valueCounts, int[] clusterCounts)
{
  int numClusters = clusterCounts.Length;
  double[] clusterEntropies = new double[numClusters];
The method accepts arrays valueCounts and clusterCounts, which hold implicit information about how tuples are currently clustered. Recall that the first step to compute overall clustering entropy is to compute the entropies of each individual cluster. These are stored in local array clusterEntropies. The entropies are computed like so:
for (int k = 0; k < numClusters; ++k)  // Each cluster
{
  for (int i = 0; i < valueCounts.Length; ++i)  // Each attribute
  {
    for (int j = 0; j < valueCounts[i].Length; ++j)  // Each value
    {
      double p = valueCounts[i][j][k] * 1.0 / clusterCounts[k];
      double lp = p * LogBaseTwo(p);  // prob * log(prob)
      clusterEntropies[k] += lp;      // Accumulate
    }
  }
  clusterEntropies[k] = -1 * clusterEntropies[k];
}
The code here assumes that clusterCounts[k] is never zero -- in other words, every cluster must have at least one tuple. The next step is to compute the probabilities of each cluster, which will serve as weights when combining the individual entropies into an overall clustering entropy:
double[] clusterProbs = new double[numClusters];
int numTuplesClustered = NumTuplesClustered(clusterCounts);
for (int k = 0; k < clusterProbs.Length; ++k)
  clusterProbs[k] = clusterCounts[k] * 1.0 / numTuplesClustered;
Here, a helper method NumTuplesClustered sums the values in array clusterCounts. A fascinating alternative is to fix all cluster probabilities to a 1.0 value. This has the effect of producing clusterings that emphasize the identification of outlier data tuples as opposed to producing clusters of roughly the same size. Method Entropy finishes by returning the sum of weighted cluster entropies:
  double overallEntropy = 0.0;
  for (int k = 0; k < numClusters; ++k)
    overallEntropy += clusterEntropies[k] * clusterProbs[k];

  return overallEntropy;
}
Two important related methods are Assign and Unassign. Method Assign assigns a tuple to a cluster in array clustering and updates arrays valueCounts and clusterCounts:
static void Assign(int tupleIndex, int[][] tuplesAsInt, int cluster,
  int[] clustering, int[][][] valueCounts, int[] clusterCounts)
{
  clustering[tupleIndex] = cluster;  // Assign
  for (int i = 0; i < valueCounts.Length; ++i)
  {
    int v = tuplesAsInt[tupleIndex][i]; // Att value
    ++valueCounts[i][v][cluster]; // Update
  }
  ++clusterCounts[cluster];  // Update
}
Notice that Assign takes a lot of input parameters. This is a general weakness of coding with static methods rather than using an OOP style. Method Unassign undoes the operations performed by Assign.
Implementing the Cluster Method
With an Entropy method in hand, implementing a method to cluster data is relatively simple. In high-level pseudo-code, method Cluster is:
define an empty clustering with all tuples unassigned
determine good (dissimilar) seed tuples
assign one good seed tuple to each cluster
loop each unassigned tuple t
  compute the entropy for clustering if t were actually assigned
  determine the cluster that gives the entropy
  assign tuple t to best cluster
end loop
For simplicity, method Cluster iterates through each unassigned tuple in order, starting at tuple [0]. This effectively gives more influence to tuples with lower number indexes. An alternative approach I often use is to iterate through unassigned tuples in random order or in scrambled order by using a linear, congruential, full-cycle generator.
The Cluster method is quite short, as you can see in Listing 2.
Listing 2. The Cluster method.
static void Cluster(int[][] tuplesAsInt, int[] clustering,
  int[][][] valueCounts, int[] clusterCounts, int numSeedTrials)
{
  int numClusters = clusterCounts.Length;
  int[] seedIndexes = GetGoodIndexes(tuplesAsInt,
    numClusters, numSeedTrials);

  for (int k = 0; k < seedIndexes.Length; ++k)
    Assign(seedIndexes[k], tuplesAsInt, k, clustering,
    valueCounts, clusterCounts);

  for (int t = 0; t < tuplesAsInt.Length; ++t)  // Each tuple
  {
    if (clustering[t] != -1) continue;

    double[] testEntropies = TestEntropies(t, tuplesAsInt, clustering,
      valueCounts, clusterCounts);
    int bestCluster = IndexOfSmallestEntropy(testEntropies);

     Assign(t, tuplesAsInt, bestCluster, clustering,
       valueCounts, clusterCounts);
  }
}
Helper method GetGoodIndexes returns the indexes of tuples that are dissimilar from each other. Helper method TestEntropies returns overall clustering entropy for each cluster, if tuple t were assigned to the cluster.
The EMIAC algorithm seeds each cluster with a single tuple. It's important that each of these seed tuples be as different from each other as possible. There are many measures of dissimilarity used by clustering algorithms. Method GetGoodIndexes generates a set of random candidate indexes, then computes the total number of tuple attributes that are different. This metric is called the Hamming distance. This process is repeated numSeedTrials times, and the indexes of the tuples that have the greatest dissimilarity are returned.
For example, consider the data in Figure 1. Suppose the candidate indexes are 0, 1, 2. The corresponding data tuples are:
[0] Red   Medium  Hard
[1] Red   Small   Soft
[2] Blue  Large   Hard
Tuples [0] and [1] differ in two positions, tuples [0] and [2] differ in two positions, and tuples [1] and [2] differ in three positions, for a total delta of 2 + 2 + 3 = 7. In pseudo-code, method GetGoodIndexes is:
init a result array
loop numSeedTrials times
  generate numClusters distinct random tuple indexes
  compute their dissimilarity
  if curr dissimilarity > greatest dissimilarity
    greatest dissimilarity = curr dissimilarity
    store curr indexes into result array
  end if
end loop
return result array
You might wish to consider alternative approaches. One advanced option is to observe that attribute Size -- with values Small, Medium and Large -- is inherently numeric. So you can modify method GetGoodIndexes so that the difference between Small and Large is greater than the difference between Small and Medium.
Refining the Clustering
Depending on your particular scenario, after an initial clustering pass through your data you might want to attempt to improve the clustering by performing one or more refining steps. There are many different ways to go about this. One possibility in pseudo-code is:
loop numRefineTrials times
  select two clusters at random
  select one random tuple from each cluster
  if swapping cluster assignments improves clustering
    swap tuples
  end if
end loop
Another possibility (again in pseudo-code) is:
loop numRefineTrials times
  select a random cluster that has 2 or more tuples
  select a random tuple from the cluster
  select a different cluster
  if moving tuple to different cluster improves clustering
    move tuple
  end if
end loop
The demo program implements this second approach as method Refine, along with helper methods GetTupleIndex and GetDifferentCluster.
Wrapping Up
Data clustering is a fascinating, complex topic. In spite of decades of research in the area there are still many unanswered questions. The code that accompanies this article -- along with the explanation of the EMIAC clustering algorithm presented here -- should get you up and running if you want to experiment with data clustering, add clustering features to an application or create a clustering utility tool. Unlike many clustering algorithms, including k-means, the EMIAC algorithm can be easily modified to deal with numeric data or mixed numeric and categorical data. The idea is to preprocess numeric data by binning it into categories. For example, if your raw data contained people's heights measured in inches, you could bin height so that values less than 60.0 are "short," values between 60.0 and 74.0 are "medium" and values greater than 74.0 are "tall."
There are many algorithms available for clustering categorical data. However, the algorithm presented here is relatively simple, has worked well in practice, can be applied to both numeric and categorical data, and scales well to huge data sets. EMIAC data clustering can be a valuable addition to your developer tool set.