The Data Science Lab
Introduction to R for .NET Developers
C# developers who want to wring more meaningful info from large sets of data should get cozy with the statistical computing language known as R. Let's get familiar with R in this new series.
The R language, which is used for statistical computing, is one of the fastest-growing technologies among my colleagues who are C# programmers. I believe this is because of the increasing volume of data collected by software systems, and the need to analyze that data. A familiarity with R can be a valuable addition to your technical skill set.
The R language is an open source GNU project and is free software. R was derived from a language called S (for "statistics") which was created at the Bell Laboratories in the 1970s. There are many excellent online tutorials for R but most of those tutorials assume you are a university student studying statistics. This article assumes you are a .NET developer who wants to get up to speed with R quickly.
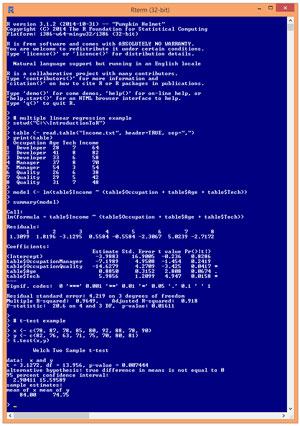
A good way to see where this article is headed is to take a look at an example interactive R session shown in Figure 1. The demo session has two examples. The first few commands show an example of linear regression, which in my opinion is the Hello World technique of statistical computing. The second set of R commands show what's called the t-test for two unpaired means.
 [Click on image for larger view.]
Figure 1. Example R Session
[Click on image for larger view.]
Figure 1. Example R Session
The R Web site has links to several mirror sites where you can download and install R. The install is a simple self-extracting executable. R is supported on Windows XP and newer OSes, and also on most common non-Windows platforms. I have installed R on Windows 7 and Windows 8 and Windows 10 machines without any issues. By default the installation process gives you both 32-bit and 64-bit versions of R.
This article assumes you have at least intermediate level C# programming skills (so you can understand the explanations of the similarities between C# and R), but does not assume you know anything about R. In addition to explaining R techniques, this article presents a C# demo program that shows how to perform a t-test so you can compare C# and R. The C# program is a bit too long to present in its entirety but the complete source code is available in the download that accompanies this article.
Linear Regression Analysis Using R
I installed R version 3.1.2 and accepted the default location of a C:\Program Files\R\R-3.2.1 directory. To launch the simple R shell shown in Figure 1, I navigated to the R.exe program located in the 64-bit bin\x64 subdirectory and double-clicked on it.
The first set of R commands in Figure 1 show an example of linear regression. Linear regression is a statistical technique that's used to describe the relationship between a numeric variable, called the dependent variable, and one or more explanatory variables, called the independent variables. The independent variables can be either numeric or categorical. When there is just one independent explanatory/predictor variable, the technique is usually called simple linear regression. When there are two or more independent variables, as in the demo, the technique is usually called multiple linear regression. Here, the goal is to predict a person's annual income from their occupation, age and some measure of technical skill.
Looking at Figure 1, you'll immediately notice that using R is quite a bit different from using C#. Although it's possible to write R scripts, R is most often used (at least among my colleagues) in an interactive mode in a command shell.
Before doing the R linear regression analysis, I created an eight-item, comma-delimited text file named Income.txt in directory C:\IntroductionToR with this content:
Occupation,Age,Tech,Income
"Developer",28,7.0,64.0
"Developer",41,8.0,82.0
"Developer",33,6.0,58.0
"Manager  ",37,8.0,70.0
"Manager  ",54,3.0,54.0
"Quality  ",26,6.0,38.0
"Quality  ",29,5.0,42.0
"Quality  ",31,7.0,48.0
This file is supposed to represent the annual incomes of people with their job occupation, age and some measure (0.0 to 10.0) of technical expertise. The idea is to predict Income values in the last column from the Occupation, Age and Tech values. Two of the Occupation values (Developer and Manager) have embedded spaces for better readability.
The R prompt is indicated by the '>' token in the shell. The first statement typed in Figure 1 begins with the '#' character, which is the R token to indicate a comment. After the comment, the first three R commands in the linear regression analysis are:
> setwd("C:\\InroductionToR")
> table <- read.table("Income.txt", header=TRUE, sep=",")
> print(table)
The first command sets the working directory so I wouldn't have to fully qualify the path to the source data file. Instead of using the "\\" token as is common with C#, I could have used "/" as is common on non-Windows platforms.
The second command uses the built-in read.table function to load the data into memory in a table object named table. Notice that R uses both anonymous and named parameters. The parameter named header tells R whether the first line is header information (TRUE, or T in shortened form) or not (FALSE or F). R is case-sensitive. In R, to assign values to variables or objects, you can usually use either the "<-" operator or the '=' operator. The choice is mostly a matter of personal preference. I typically use "<-" for object assignment and "=" for parameter value assignment.
The sep (separator) parameter indicates how values on each line are separated. For example, "\t" would indicate tab-delimited values, and " " would indicate space-delimited values.
In R, the '.' character is often used rather than the '_' character to create variable and function names that are easier to read. If you are a very experienced .NET developer, the common R use of the period character in variable and function names can take some time to get used to.
The print function displays the data table in memory. The print function has many optional parameters. Notice that the output in Figure 1 displays data item indices starting at 1. For array, matrix and object indices, R is a 1-based language rather than 0-based as in the C# language.
The linear regression analysis is performed by these two R commands:
> model <- lm(table$Income ~ (table$Occupation + table$Age + table$Tech))
> summary(model)
You can interpret the first command as, "Store into an object named 'model' the result of the lm (linear model) function analysis where the dependent variable to predict is the Income column in the table object (table$Income), and the independent predictor variables are Occupation, Age and Tech." The second command means, "Display just the basic results of the analysis stored in the object named model."
The lm function generates a large amount of information. Suppose you wanted to predict the Income value when the input values are Occupation = Manager, Age = 37 and Tech = 8.0. (Notice that this corresponds to data item [4] that has an actual Income value of 70.0.) To make a prediction you'd use the values in the Estimate column:
Coefficients:
Estimate Std. Error t value Pr(>|t|)
(Intercept)                -3.9883    16.9005  -0.236   0.8286
table$OccupationManager    -7.1989     4.9508  -1.454   0.2419
table$OccupationQuality   -14.6279     4.2709  -3.425   0.0417 *
table$Age                   0.8850     0.3152   2.808   0.0674 .
table$Tech                  5.9856     1.2099   4.947   0.0158 *
If X represents the independent variables, and if Y represents the predicted Income, then:
X = (Developer = NA, Manager = 1, Quality = 0, Age = 37, Tech = 8.0)

Y = -3.9883 + (-7.1989)(1) + (-14.6279)(0) + (0.8850)(37) + (5.9856)(8.0)
  = -3.9883 + (-7.1989) + (0) + (32.745) + (47.8848)
  = 69.44
Notice the predicted Income, 69.44, is very close to the actual Income, 70.0.
In words, to make a prediction using the model, you calculate a linear sum of products of the Estimate values times their corresponding X values. The Intercept value is a constant not associated with any variable. When you have categorical explanatory variables, one of the values is dropped (Developer in this case).
The information at the bottom of the output display indicates how well the independent variables, Occupation, Age and Tech, explain the dependent variable, Income:
Residual standard error: 4.219 on 3 degrees of freedom
Multiple R-squared:  0.9649,    Adjusted R-squared:  0.918
F-statistic:  20.6 on 4 and 3 DF,  p-value: 0.01611
The multiple R-squared value (0.9649) is the percentage of variation in the dependent variable explained by the linear combination of the independent variables. Put slightly differently, R-squared is a value between 0 and 1 where higher values mean a better predictive model. Here the R-squared value is extremely high indicating Occupation, Age and Tech can predict Income very accurately. The F-statistic, adjusted R-squared value, and p-value are other measures of model fit.
One of the points of this example is that when using R, your biggest challenge, by far, is understanding the statistics behind the language functions. You have to know which R function to use, and how to interpret the output.
Most people learn R in an incremental way, by adding knowledge of one technique at a time, as needed to answer some specific question. A C# analogy would be learning about the various .NET namespaces. When you first started using .NET you probably didn't learn about the System.IO namespace until you needed to read a text file. Most developers learn about one namespace at a time rather than trying to memorize information about all the namespaces before writing any programs.
The t-Test Using R
The second example in Figure 1 shows a t-test. The goal of the t-test is to determine if there's statistical evidence that the source means of two sets of sample numbers are the same or not. The two commands in the example are:
> x <- c(78, 87, 78, 85, 80, 92, 88, 78, 90)
> y <- c(82, 76, 63, 71, 75, 70, 80, 81)
These commands create two vectors, x and y, using the c ("concatenate") function. The numbers are supposed to represent sample test scores of two different groups. An R vector can hold objects of different types. I could have made R numeric arrays like so:
> x <- array(c(78, 87, 78, 85, 80, 92, 88, 78, 90))
> y <- array(c(82, 76, 63, 71, 75, 70, 80, 81))
A roughly equivalent C# statement would be:
var x = new double[] { 78, 87, 78, 85, 80, 92, 88, 78, 90 };
As it turns out, the mean of the x-data is 84.00 and the mean of the y-data is 74.75. So the sample means are different, but could the difference in average test score be due to chance rather than due to a true difference in the population scores?
After creating the vectors, the t-test is performed by issuing a single R command:
> t.test(x,y)
The result of calling the R t.test function is quite a bit of text:
Welch Two Sample t-test

data:  x and y
t = 3.1272, df = 13.956, p-value = 0.007444
alternative hypothesis: true difference in means is not equal to 0
95 percent confidence interval:
  2.90411 15.59589
sample estimates:
mean of x mean of y
    84.00     74.75
There are several different variations of the t-test. R uses a variation called Welch's t-test.
The t statistic and the df value ("degrees of freedom") are calculated from the input data. The t statistic is often called Student's t. The t statistic and df value are used to compute the p-value of 0.007444. A p-value is the probability that the two means of the two data sets under investigation are equal. In this case the p-value is so low, well under 1 percent (0.01), that you'd conclude that there's statistical evidence that the means of the two data sets are not equal.
In C# terms, most R functions, including the t.test, return a data structure that can be ignored, but contain many Console.WriteLine equivalent statements that expose output. It's up to you to decipher the meaning of R output.
Graphs with R
As a C# programmer, when I want to make a graph of some program output data, I typically run my program, copy the output data, paste the data into Notepad to remove control characters, then copy that data, paste it into Excel, and then create a graph using Excel. This approach is a bit inconvenient but works fine in most situations.
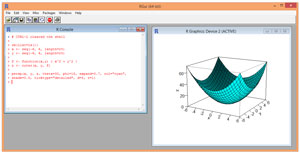
One of the strengths of the R system is its native ability to generate graphs. Take a look at an example in Figure 2. This is a 3-D type graph that isn't possible in Excel without an add-in of some sort.
 [Click on image for larger view.]
Figure 2. 3-D Graph Using R
[Click on image for larger view.]
Figure 2. 3-D Graph Using R
In addition to the simple shell program in Figure 1, R also has a semi-GUI interface, RGui.exe, for use when you want to make graphs.
The graph in Figure 2 shows the function z = f(x,y) = x^2 + y^2. The first three R commands to generate the graph are:
> rm(list=ls())
> x <- seq(-6, 6, length=25)
> y <- seq(-6, 6, length=25)
The rm function deletes an object from the current workspace in memory. The command used is a magic R incantation to delete all objects from the workspace. The second and third commands create vectors of 25 values, evenly spaced, from -6 to +6 inclusive. I could've used the c function with hardcoded values instead.
The next two commands are:
> f <- function(x,y) { x^2 + y^2 }
> z <- outer(x,y,f)
The first command shows how to define a function in R using the function keyword. Next, the built-in R function named outer creates a matrix of values using vectors x and y, and a function definition f. The result is a 25x25 matrix named z where the value in each cell is the value of function f that corresponds to x and y.
The 3-D graph is displayed using the persp ("perspective graph") function:
> persp(x, y, z, theta=30, phi=15, expand=0.7, col="cyan",
+ shade = 0.5, ticktype="detailed", d=5, r=1)
When typing a long line in R, if you hit the Enter key before the end of the command, the system will jump the cursor down to the next line and place a '+' character as a prompt to indicate your command is not yet complete.
The persp function has a lot of optional, named parameters. Parameter theta controls the left-right viewing angle. Parameter phi controls the up-down viewing angle. The parameter named expand controls the ratio of the height and width of the graph. The col parameter is the color (or colors) to use. The parameter named shade controls simulated shading from a virtual light source. Parameter ticktype controls how values on the x, y, and z axes are displayed. Parameters r and d control the perceived eye distance to the graph, and the perceived 3-D effect. The persp function has many more parameters, but the ones used here will be sufficient in most situations.
This example points out that R has very powerful and flexible native graphing capabilities, but they tend to be relatively low-level and require a fair amount of effort.
The t-Test in C#
In order for you to gain an understanding of the similarities and differences between R language analyses and C# language programming, it's useful to examine a C# implementation of a t-test. In addition, the C# code can make a nice addition to your personal code library.
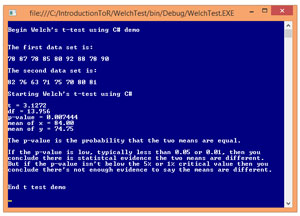
Take a look at the C# demo program in Figure 3. The demo program approximates the R language t-test shown in Figure 1. Notice the output values of the C# demo are exactly the same as those in the R session.
The key code in the demo program is the calculation of the p-value, defined in method Student. The code for method Student is presented in Listing 1. Even a quick glance at the code should make it obvious that the method requires deep math knowledge.
 [Click on image for larger view.]
Figure 3. t-Test Using C#
Listing 1: Student Method
[Click on image for larger view.]
Figure 3. t-Test Using C#
Listing 1: Student Method
public static double Student(double t, double df)
{
  // For large integer df or double df
  // Adapted from ACM algorithm 395
  // Returns 2-tail p-value
  double n = df; // to sync with ACM parameter name
  double a, b, y;

  t = t * t;
  y = t / n;
  b = y + 1.0;
  if (y > 1.0E-6) y = Math.Log(b);
  a = n - 0.5;
  b = 48.0 * a * a;
  y = a * y;

  y = (((((-0.4 * y - 3.3) * y - 24.0) * y - 85.5) /
    (0.8 * y * y + 100.0 + b) + y + 3.0) / b + 1.0) *
    Math.Sqrt(y);
  return 2.0 * Gauss(-y); // ACM algorithm 209
}
Surprisingly, coding complicated numerical functions isn't as difficult as you might first guess because there are many resources available. Two of my most frequently used references are the Collected Algorithms (CALGO) repository of the Association for Computing Machinery (ACM) and the "Handbook of Mathematical Functions" by Abramowitz and Stegun (so well-known it's often just called "A&S"). Both references are freely available in several places on the Web.
Method Student implements ACM Algorithm number 395 and calls a helper method, Gauss, which implements ACM Algorithm 209. An alternative to ACM 209 is A&S equation #7.1.26 plus a simple wrapping statement.
Many of the functions in the ACM CALGO and A&S are implemented in existing C# libraries, but most of those libraries are quite large. When possible I prefer to code from scratch, using just those methods I need and avoiding external dependencies.
A Few Comments
There are a few R language integrated development tools you can use. One well-known project is called RStudio. I generally prefer using the native R console. Several Microsoft products work with R. For example, the Microsoft Azure Machine Learning service can use R language scripts. I suspect that support for R will be added to Visual Studio at some point.
This article shows only a tiny fraction of the R language, but it should be enough to get you up and running with R. Naturally, the best way to get familiar with R is to actually try it out. Installing R (and uninstalling, if necessary) is quick and painless, and running the three R examples presented in this article will give you a great feel for the language.