Cross Platform C#
Performance Profiling Your Xamarin Apps
Learn to measure the performance of your apps and ensure a great UX.
- By Greg Shackles
- 12/18/2015
In addition to how an app looks and what it does, a major contributor to an app's UX is how well it performs. With so much competition and an abundance of high-quality apps available in the app stores, users now have high expectations for apps to be quick and easy to use. Mobile devices also simply don't have the resources you might be used to when working on desktop or Web applications, so it's always important to keep these processing and memory constraints in mind when designing your apps.
When it comes to actually profiling apps there are many different tools at your disposal. To start with, because Xamarin apps are completely native you can take advantage of any tools already available for the platform, including the Apple Instruments tool for iOS or the variety of tools offered by Google for Android. On top of those, Xamarin is also working on its own profiler, which as of right now is in a public preview form.
Before getting into actually measuring anything, I also want to point out that in many cases perceived performance actually outweighs any pure measurement metrics you get from measuring your apps. That doesn't mean you should ignore these metrics by any means, but ultimately it's how a user perceives the performance of the app that often ends up mattering the most. In many cases there are subtle things you can do in the UI, such as animations, to help smooth out the experience and make the app seem as though it's performing optimally even if the user is technically being forced to wait for an operation to complete.
The Xamarin Profiler
One big advantage of the Xamarin profiler over other tools is that Xamarin has first-class knowledge of the Mono runtime, which allows for exposing a better view of what's going on as it relates to the actual code you're writing. The profiler works by analyzing your app while it's running and being used, and allows you to dig into things like memory usage and method timing. Currently you can use the profiler to analyze iOS and Android apps on Mac OS X, and Android apps from Windows.
To take a look at how the profiler works, I'll start with a brand-new Android project. The Xamarin default Android project template includes a UI with a single button, so I'll leave that in there as a starting point for our exploration.
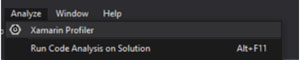
In the Visual Studio Analyze menu you'll find an option for Xamarin Profiler (see Figure 1), which will fire up the profiler, launch the app in the selected device or emulator, and begin profiling the app.
 [Click on image for larger view.]
Figure 1. Running the Profiler from Visual Studio
[Click on image for larger view.]
Figure 1. Running the Profiler from Visual Studio
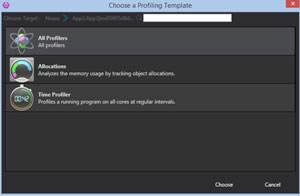
Once the profiler starts you're presented with a choice of what you would like to profile (see Figure 2). For this example, I'll go with All Profilers, which will include both timing and memory allocation analysis.
 [Click on image for larger view.]
Figure 2. Profilers Available To Use for Analyzing an App
[Click on image for larger view.]
Figure 2. Profilers Available To Use for Analyzing an App
Now that the app is running, you can use it normally and the profiler will update based on the timing and memory usage information it collects along the way. When you reach certain parts of your app's flow that you'd like to specifically capture, you can make use of the snapshot button, which is located toward the top of the interface, next to the timer.
Let's take a quick look at the two profilers available.
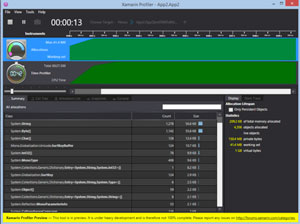
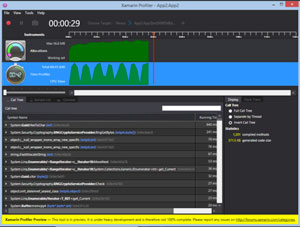
Allocations: The first instrument available in the Xamarin profiler is Allocations, which tracks the memory usage of the app (see Figure 3). It will show the maximum amount of memory that was used by the app, as well as allow you to dig into what specifically was making up that memory usage.
 [Click on image for larger view.]
Figure 3. Analyzing Memory Allocations for the App
[Click on image for larger view.]
Figure 3. Analyzing Memory Allocations for the App
There are several useful tabs available for this instrument that give you different views into the app's memory usage. The Summary tab gives a high-level overview of the types that are consuming memory, along with the count of instances of that type and the total size they are. The Call Tree tab provides a view into the different method calls of an app and the memory usage on each, as well as providing several display options for sorting the tree in different ways. Additionally, you can look at the full allocation list, as well as any snapshots you might have captured.
Time Profiler: As the name implies, the Time Profiler allows you to dig into how long different methods took to complete. Just like the Allocations profiler, Time also exposes a Call Tree tab that gives a look into where time was spent in the app. A good place to start in this tab is to switch to the Invert Call Tree display mode, which will allow you to see method times at the most granular level first and then start working your way back out from there.
Let's Make It More Interesting
With that overview out of the way, I'll update the app to have something a little more interesting to profile, as shown in Listing 1.
Listing 1: Adding Some Behavior to the App
public class MainActivity : Activity
{
  private readonly List<string> _strings = new List<string>();

  protected override void OnCreate(Bundle bundle)
  {
    base.OnCreate(bundle);

    SetContentView(Resource.Layout.Main);

    var button = FindViewById<Button>(Resource.Id.MyButton);
    button.Click += buttonClicked;
  }

  private void buttonClicked(object sender, EventArgs e)
  {
    _strings.AddRange(Enumerable.Range(0, 10000).Select(
      _ => Guid.NewGuid().ToString()));
  }
}
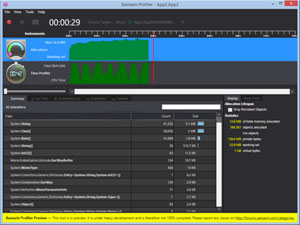
Now each time the button is tapped the app will allocate 10,000 strings and add them to a collection. This should allow us to easily observe some increased memory consumption and processing in the app. When the app starts up, tap the button a few times to build up the memory usage. In addition to just racking up memory allocations, you should also see that the app is slow to respond to the button tap due to all the work being done in the button's click event. After tapping it a few times you should see something similar to Figure 4, which shows a steady ramp up of memory allocations, which are largely made up of System.String instances, as expected.
 [Click on image for larger view.]
Figure 4. Looking into Increased Memory Allocations in the App
[Click on image for larger view.]
Figure 4. Looking into Increased Memory Allocations in the App
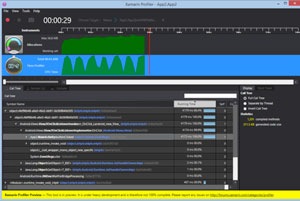
In addition to just the memory allocations, the Time Profiler also shows some big spikes that coincide with each tap of the button (see Figure 5). By inverting the call tree it's easy to pick out that the usage of System.Guid and getting its string representation accounted for the vast majority of the processing time here.
 [Click on image for larger view.]
Figure 5. Determining Which Methods are Taking Longest To Complete
[Click on image for larger view.]
Figure 5. Determining Which Methods are Taking Longest To Complete
By looking at the full call tree (Figure 6) we can see that the button's click event accounted for 88 percent of the app's total processing time. This shouldn't be surprising given the simplicity of the app's implementation, but the key takeaway here is how easy it is to pinpoint where the app is spending its time.
 [Click on image for larger view.]
Figure 6. Exposing the Click Handler Accounting for Most of the App's Processing Time
[Click on image for larger view.]
Figure 6. Exposing the Click Handler Accounting for Most of the App's Processing Time
Hand-Rolled Measurements
Profiling tools are great, but sometimes it can be useful to do some custom measurements of your apps, as well. Sometimes this can be as simple as wrapping some of your method calls in timers and looking at the time spent in them. This allows you total flexibility to report those timings in any way you see fit, be it to the console output of the app, an API or whatever is useful to you.
To demonstrate a simple and fun way to approach doing this, I'm going to make use of Fody. Fody is a library that allows you to easily manipulate the IL (intermediate language) of an application at compile time to do a variety of things without having to write boilerplate code. People have written all sorts of plug-ins for Fody over the years, such as automatically inserting property changed notifications, logging calls, or virtualizing members of a class.
For this example, I'll use the MethodTimer add-in, which can be used to time specific methods. To get started, I'll add the MethodTimer.Fody NuGet package to the application. The package will automatically create a FodyWeavers.xml file that includes a reference to the MethodTimer add-in. This file is the manifest that defines how Fody should transform your project at compile time.
With that in place, the next step is to decorate the button's click handler with TimeAttribute:
[Time]
private void buttonClicked(object sender, EventArgs e)
{
   strings.AddRange(Enumerable.Range(0, 10000).Select(_ => Guid.NewGuid().ToString()));
}
The compiled version of this method in the resulting DLL will then look something like that in Listing 2.
Listing 2: App Code After Being Processed by Fody
private void buttonClicked(object sender, EventArgs e)
{
  Stopwatch methodTimerStopwatch = Stopwatch.StartNew();
  try
  {
    strings.AddRange(Enumerable.Range(0, 10000).Select(_ => Guid.NewGuid().ToString()));
  _}
  finally
  {
    _methodTimerStopwatch.Stop();
    _Debug.WriteLine("MainActivity.buttonClicked " +
      methodTimerStopwatch.get_ElapsedMilliseconds() + "ms");
  }
}
Fody injects the timing instrumentation into the class during compilation without you needing to write any of it by hand. Running the app now will result in debug output whenever the button is tapped:
MainActivity.buttonClicked 31ms
MainActivity.buttonClicked 41ms
In addition to the default behavior of using Debug.WriteLine, you can also define your own interceptor by creating a static class named MethodTimeLogger:
public static class MethodTimeLogger
{
  public static void Log(MethodBase methodBase, long milliseconds)
  {
    // Put custom logging here
  }
}
With this class defined, instead of the Debug.WriteLine call, Fody will instead delegate to your interceptor, allowing you to handle the results of that timing operation any way you'd like.
Wrapping Up
There are many other things to consider when profiling apps on top of what was covered here, but hopefully this starts to give you an idea on how you can approach instrumenting your apps and measuring performance.
Always remember that you should never trust the performance of an emulator or simulator, which would be taking advantage of the full resources of your host machine and, thus, don't provide an accurate representation of how the app will behave on a real device. If you're using the Xamarin Test Cloud you can also make use of that to see what your app's memory consumption and processing time look like across a wide array of devices.
If you're not measuring along the way, you won't have a good way of knowing if the changes you're making to your apps are having the impact you want. In the end, just remember that the experience you deliver to your users is the most important thing, and these are just tools to help us deliver on that goal.