Visual Studio Toolbox
16 New Code Analysis, Testing and Debugging Tools For Visual Studio 2017
Here's a look at some new some linters, code analyzers and debuggers to augment Visual Studio's built-in tools.
- By Terrence Dorsey
- 05/17/2018
Back in the day, we'd write some code, compile, execute, see what happened and repeat. That was testing. (Sometimes that's still what testing looks like, for better or worse.) Today, we can do a lot better.
Today we have IntelliSense, linters, real-time code analysis, automated test builders, automated test runners, test coverage analysis.... The list goes on, and that's just the tools we use to make sure code is as bulletproof as possible before we run a build. From build and compile we have debugging tools and more. These days there is very little reason for your code to include architectural or language-level errors.
Visual Studio has always included debugging tools and added built-in code analysis and testing tools since at least Visual Studio 2012. These tools just keep getting better with each new release, but they don't cover every use case, and some don't get updated as frequently as we'd like to cover new language features or code architectures.
Back in October 2017 I wrote a roundup of Code Analysis, Profiling and Refactoring Tools for Visual Studio 2017 for Visual Studio Magazine that covers some of the built-in tools plus a selection of current third-party tools. In this column I'll cover some linters, code analyzers and debuggers that have been released or updated since then.
Linters and Code Analysis
GCop is a fairly new set of C# code analysis rules (with really nice setup, use and rules documentation) from Geeks Ltd., which may be worth checking out if you're not entirely satisfied with other code analysis rulesets (or perhaps using alongside of those other rules for extended coverage). GCop is intended to be installed in your project as a NuGet package. To allow for rules that can't run from a package, Paymon (a co-founder of Geeks Ltd.) has released a GCop.Extra Visual Studio 2017 extension for use with GCop. The extension enables GCop rules such as Minimum Scope that detect whether methods that are more visible than they need to be (private versus internal versus public).
MultiLinter, by Giovanni Lambiase, enables you to replace the (already outdated) linters built into Visual Studio 2017 with the standard linters available through Node.js including (but not limited to) ESLint, JSLint, JSHint, Stylelint, CssLint and Sass-lint. MultiLinter lets you turn verbose debugging on, configure which linters to use (including running multiple linters against a file at the same time), update linters and linting rules, set rule severity warnings, and much more.
XamRight, from Critical Hit Tech, is an extension for Visual Studio 2015 and 2017 that brings design-time code analysis and coding assistance to Xamarin.Forms XAML development. You get IntelliSense, warnings, view model and data binding analysis and debugging, navigation tools for moving between XAML and C# model definitions, custom view implementations and more, along with navigation from XAML resource references to definitions. XamRight can analyze your own model-view model binding, but also includes built-in support for popular MVVM frameworks including MVVMCross, MVVMLight, FreshMVVM, Prism and Caliburn.Micro. A 30-day free trial is available and licensing is available on a monthly or yearly basis.
NDepend (see Figure 1), one of the most popular commercial static code analysis tools for .NET Framework development, recently released a substantial update including support for .NET Core 2.1, ubiquitous language checks in Domain Driven Design (DDD), performance improvements for Visual Studio 2017 and over a dozen new or improved code analysis rules. A key new feature for NDepend is real-time technical debt estimation that's updated as you code. Proud of that new method? Guess what, you just added 30 minutes of future technical debt. Maybe check NDepend's analysis and spend a minute refactoring. I love it. NDepend offers a free 14-day trial and per-developer or per-build machine licensing.
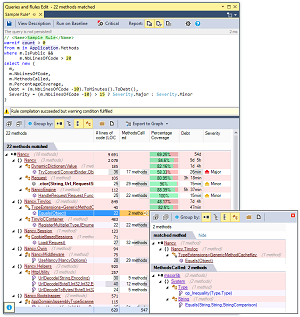 [Click on image for larger view.] Figure 1. NDepend's Static Analysis Tools Have Been Updated for .NET Core 2
Priyanshu Agrawal's Async Method Name Fixer is an effective little tool for doing a simple but often overlooked task: making sure your async methods are named appropriately. In a nutshell, it looks for methods defined as async and, if you haven't given the method a name with "Async" on the end, the extension flags all instances of the method and calls to it.
Code Coverage and Testing
AxoCover, by axodox (Péter Major), provides Visual Studio integration for code coverage and unit testing with OpenCover. AxoCover lets you run, debug and check code coverage for unit tests in .NET Framework projects for Windows. You can browse and analyze coverage by test in a hierarchical view and dig down into line-by-line coverage and test results. AxoCover supports the MSTest, xUnit and NUnit test frameworks.
SmartTests.Extension, by Ludovic Dubois, is an extension to show current and missing tests for NUnit, Xunit and MSTest within Visual Studio. SmartTests.Extension integrates into your Visual Studio environment the Pretty Objects SmartTests library, which helps you write smart unit tests, and the SmartTests.Analyzer, a Roslyn Analyzer to display missing tests as warnings. The extension shows tests in a centralized window, lets you see current tests and any missing tests, and lets you navigate quickly to specific tests.
SmartBear's TestLeft UI test automation framework (see Figure 2) has been updated to support Visual Studio 2013, 2015 and 2017. TestLeft integrates directly into the Visual Studio development environment, enabling you to create tests as you code. A built-in object spy gives you the ability to create tests that support over 500 common Web and desktop UI controls. You can create automated tests for a variety of popular development frameworks including .NET Framework, Winforms, WPF, Java, HTML5 and AngularJS. Further test coverage includes controls from Infragistics, DevExpress, Syncfusion and Telerik, along with cross-browser testing with legacy versions of Internet Explorer, Edge, Firefox and Chrome. Tests created in TestLeft can be migrated into TestComplete for automated testing as part of your continuous integration and release management processes. Register online for a free 30-day trial. Yearly per-node and floating licenses are available from SmartBear.
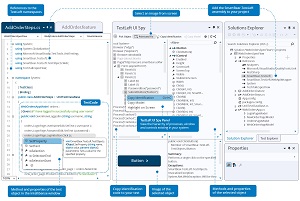 [Click on image for larger view.] Figure 2.TestLeft Simplifies the Creation of UI Test Automation as You Code
Better Debugging
Angel Hernandez's VisualSOS.Extension (see Figure 3) gives you access to features of the Microsoft SOS Debugging Extension and Windbg that are not available directly from the Visual Studio Debugger. VisualSOS.Extension also gives you menu access to those features instead of having to remember the commands and option flags. Visual SOS is available as both a Visual Studio 2017 extension and a stand-alone debugger. To learn more, see Hernandez's blog post Visual SOS – Visual Studio extension to debug managed applications through SOS for an overview and some tips for more effective debugging with SOS.
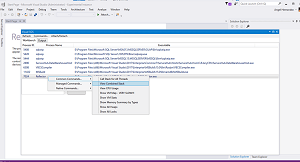 [Click on image for larger view.] Figure 3.VisualSOS Adds SOS and WinDbg Debugging Tools to Visual Studio
LINQBridgeVs, from Coding Adventures, provides a Custom Debugger Visualizer within Visual Studio that creates a bridge between your Visual Studio debugging session and the external LINQPad scratchpad and test environment. After rebuilding your project, you can right-click on any public classes or structs in the project and open the related debugging data within LINQPad. The extension supports Visual Studio 2012, 2013, 2015 and 2017 along with LINQPad 4 or 5, but is limited to .NET Framework 4.0 and above. Check the documentation for installation and troubleshooting notes.
Microsoft's VS Live Share, currently in preview (see Figure 4), provides a collaborative development environment for Visual Studio 2017, enabling you to share code, collaboratively edit, securely share local servers and even collaboratively debug your code in real-time. It's not a screen share service or centralized codebase; you're able to work independently in your local Visual Studio environment while collaborating on code editing and debugging. As we go to press, the VS Live Share is in limited preview: anyone can download the extension, run it and join a session, but permission to share a session requires registration and acceptance into the preview. For more details about VS Live Share including demos, see the Visual Studio Live Share Web site and Visual Studio Live Share Microsoft Docs.
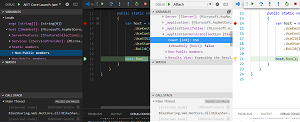 [Click on image for larger view.] Figure 4.VS Live Share Lets You Join Collaborative Editing and Debugging Sessions
Inlining Analyzer, by Stephan Zehetner, helps analyze and streamline debugging for methods inlined by the JIT compiler. Inlining can be a powerful performance enhancement for your code, but getting the best results requires careful coding, testing and time-consuming performance testing. Inlining Analyzer simplifies the task by scanning your code, highlighting methods that will be inlined, providing warnings and tooltips for methods that fail to inline, and streamlining the JIT compilation tasks needed to test for inline method tracing.
More Related Tools and Extensions
Ralph Jansen's StyleCop Check-in Policy has been updated with support for Visual Studio 2012 through 2017. It's a simple extension that lets you toggle StyleCop warnings so they don't get in the way for incremental local builds, but can be turned back on to fix issues before checking in your code.
Sharpen is a new Visual Studio 2017 extension that aims to help you introduce new C# features into your code in an intelligent manner. Sharpen analyzes your code and determines where new C# features might be useful, but it doesn't just try to jam new features into your project. You'll see both the pros and cons of adding the feature before committing. If you want to use the feature, Sharping provides one-click refactoring to use the feature consistently throughout your project. Sharpen is open source and free!
There's a lot of code analysis data being created by all these tools. What if you could harness it for further meta-analysis, visualization, or other purposes? An interesting step in this direction is demonstrated by Microsoft SARIF Viewer for Visual Studio 2015 and 2017, by Microsoft DevLabs. The extension gives you a UI for viewing static analysis log files created using the new Static Analysis Results Interchange Format (SARIF) standard. The SARIF Viewer extension displays analysis results in the Visual Studio Error List and result details in a dockable tool window. You can right-click a highlighted error line to open the target file. If you find this interesting, take a closer look at the SARIF .NET SDK and SARIF specification to get an idea what my be possible for code analysis logging, data meta-analysis and data visualization, not to mention the possibility of componentized code analysis tooling.
While not directly related to testing and debugging, Dotfuscator, from PreEmptive Solutions, is an important tool for safely releasing your code into the world. Dotfuscator is a code obfuscater and application hardener specifically tailored to .NET Framework-based projects including Xamarin, Unity, ASP.NET and UWP apps. In addition to renaming, string encryption, metadata stripping and other transformations, Dotfuscator also compacts your code to reduce application size, watermarks your application with copyright information to combat intellectual property theft, and can even detect unauthorized tampering and debugging. A free trial and licensing information can be found on the PreEmptive Solutions Web site.
A Note To Extension Developers
A tip for extension developers from a developer who uses them and writes about them: If you want developers to use your tools, it's really, really important to provide documentation. At the very least explain what your tool is supposed to accomplish and its basic requirements and dependencies. Optimally you'll explain what it does, why it's useful, an overview of features, how to use it and how to troubleshoot problems.
Whether you're sharing your tools, libraries, or extensions on Visual Studio Marketplace, GitHub, or your own Web site, it's absolutely crucial to your users to provide solid documentation. Also, I simply ignore tools that are undocumented. You won't see them here no matter how potentially useful or revolutionary.