The Data Science Lab
How to Do Machine Learning Perceptron Classification Using C#
Dr. James McCaffrey of Microsoft Research uses code samples and screen shots to explain perceptron classification, a machine learning technique that can be used for predicting if a person is male or female based on numeric predictors such as age, height, weight, and so on. It's mostly useful to provide a baseline result for comparison with more powerful ML techniques such as logistic regression and k-nearest neighbors.
Perceptron classification is arguably the most rudimentary machine learning (ML) technique. The perceptron
technique can be used for binary classification, for example predicting if a person is male or female based on
numeric predictors such as age, height, weight, and so on. From a practical point of view, perceptron
classification is useful mostly to provide a baseline result for comparison with more powerful ML techniques
such as logistic regression and k-nearest neighbors.
From a conceptual point of view, understanding how perceptron classification works is often considered
fundamental knowledge for ML engineers, is interesting historically, and contains important techniques used by
logistic regression and neural network classification. In fact, the simplest type of neural network is often
called a multi-layer perceptron.
Additionally, understanding exactly how perceptron classification works by coding a system from scratch allows
you to understand the system's strengths and weaknesses in case you encounter the technique in an ML code
library. For example, the Azure ML.NET library has a perceptron classifier, but the library documentation
doesn't fully explain how the technique works or when to use it.
A good way to get a feel for what perceptron classification is and to see where this article is headed is to
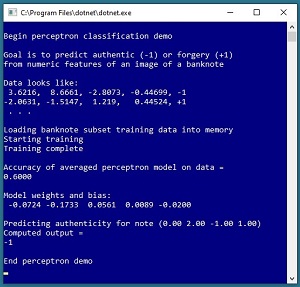
take a look at the screenshot of a demo program in Figure 1. The goal of the demo is to create a model
that predicts if a banknote (think dollar bill or euro) is authentic or a forgery.
 [Click on image for larger view.] Figure 1: Perceptron Binary Classification
Demo
[Click on image for larger view.] Figure 1: Perceptron Binary Classification
Demo
The demo program sets up a tiny set of 10 items to train the model. Each data item has four predictor variables
(often called features in ML terminology) that are characteristics of a digital image of each banknote:
variance, skewness, kurtosis, and entropy. Each data item is labeled as -1 (authentic) or +1 (forgery).
Behind the scenes, the demo program uses the 10-item training dataset to create a perceptron prediction model.
The final model scores 0.6000 accuracy on the training data (6 correct predictions, 4 wrong). The demo concludes
by using the perceptron model to predict the authenticity of a new, previously unseen banknote with predictor
values (0.00, 2.00, -1.00, 1.00). The computed output is -1 (authentic).
This article assumes you have intermediate or better skill with C# but doesn’t assume you know anything about
perceptron classification. The complete code for the demo program shown is presented in this article. The code
is also available in the file download that accompanies this article.
Understanding the Data
The demo program uses a tiny 10-item subset of a well-known benchmark collection of data called the Banknote
Authentication Dataset. The full dataset has 1,372 items, with 762 authentic and 610 forgery items. You can find
the complete dataset in many places on the Internet, including here for
convenience.
Most versions of the dataset encode authentic as 0 and forgery as 1. For perceptron classification, it's much
more convenient to encode the two possible class labels to predict as -1 and +1 instead of 0 and 1. Which class
is encoded as -1 and which class is encoded as +1 is arbitrary but it's up to you to keep track of what each
value means.
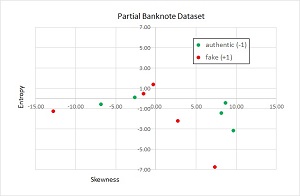
Because the data has four dimensions, it's not possible to display the data in a two-dimensional graph. However,
you can get an idea of what the data is like by taking a look at a graph of partial data shown in Figure
2.
 [Click on image for larger view.] Figure 2: Partial Graph of the Banknote
Authentication Data
[Click on image for larger view.] Figure 2: Partial Graph of the Banknote
Authentication Data
The graph plots just the skewness and entropy of the 10 items. The key point is that perceptron classifiers only
work well with data that is linearly separable. For data that is linearly separable, it's possible to draw a line
(or hyperplane for three or more dimensions) that separates the data so that all of one class is on one side of
the line and all of the other class is on the other side. You can see in Figure 2 that no line will perfectly
separate the two classes. In general, you won't know in advance if your data is linearly separable or not.
Understanding How Perceptron Classification Works
Perceptron
classification is very simple. For a dataset with n predictor variables, there will be n weights plus one
special weight called a bias. The weights and bias are just numeric constants with values like -1.2345 and
0.9876. To make a prediction, you sum the products of each predictor value and its associated weight and then
add the bias. If the sum is negative the prediction is class -1 and if the sum is positive the prediction is
class +1.
For example, suppose you have a dataset with three predictor variables and suppose that the three associated
weight values are (0.20, -0.50, 0.40) and the bias value is 1.10. If the item to predict has values (-7.0, 3.0,
9.0) then the computed output is (0.20 * -7.0) + (-0.50 * 3.0) + (0.40 * 9.0) + 1.10 = -1.4 + (-1.5) + 3.6 + 1.1
= +1.8 and therefore the predicted class is +1.
Of course the tricky part is determining the weights and bias values of a perceptron classifier. This is called
training the model. Briefly, training is an iterative process that tries different values for the model's
weights and the bias until the computed outputs closely match the known correct class values in the training
data.
Because of the way perceptron classification output is computed, it's usually a good idea to normalize the
training data so that small predictor values (such as a GPA of 3.15) aren't overwhelmed by large predictor
values (such as an annual income of 65,000.00). The demo program doesn't used normalized data because all the
predictor values are roughly in the same range (about -15.0 to + 15.0). The three most common normalization
techniques are min-max normalization, z-score normalization, and order of magnitude normalization.
The Demo Program
To create the demo program, I launched Visual Studio 2019. I used the Community (free) edition but any
relatively recent version of Visual Studio will work fine. From the main Visual Studio start window I selected
the "Create a new project" option. Next, I selected C# from the Language dropdown control and Console from the
Project Type dropdown, and then picked the "Console App (.NET Core)" item.
The code presented in this article will run as a .NET Core console application or as a .NET Framework
application. Many of the newer Microsoft technologies, such as the ML.NET code library, specifically target .NET
Core so it makes sense to develop most new C# machine learning code in that environment.
I entered "Perceptron" as the Project Name, specified C:\VSM on my local machine as the Location (you can use
any convenient directory), and checked the "Place solution and project in the same directory" box.
After the template code loaded into Visual Studio, at the top of the editor window I removed all using
statements to unneeded namespaces, leaving just the reference to the top-level System namespace. The demo needs
no other assemblies and uses no external code libraries.
In the Solution Explorer window, I renamed file Program.cs to the more descriptive PerceptronProgram.cs and then
in the editor window I renamed class Program to class PerceptronProgram to match the file name. The structure of
the demo program, with a few minor edits to save space, is shown in Listing 1.
Listing 1. Perceptron Classification Demo Program Structure
using System;
namespace Perceptron
{
  class PerceptronProgram
  {
  static void Main(string[] args)
  {
    Console.WriteLine("Begin perceptron demo");
    Console.WriteLine("Authentic (-1) fake (+1)");
    Console.WriteLine("Data looks like: ");
    Console.WriteLine(" 3.6216,  8.6661," +
      " -2.8073, -0.44699, -1");
    Console.WriteLine("-2.0631, -1.5147," +
      "  1.219,   0.44524, +1");

    Console.WriteLine("Loading data");
    double[][] xTrain = new double[10][];
    xTrain[0] = new double[] { 3.6216, 8.6661,
      -2.8073, -0.44699 }; // auth
    xTrain[1] = new double[] { 4.5459, 8.1674,
      -2.4586, -1.4621 };
    xTrain[2] = new double[] { 3.866, -2.6383,
      1.9242, 0.10645 };
    xTrain[3] = new double[] { 2.0922, -6.81,
      8.4636, -0.60216 };
    xTrain[4] = new double[] { 4.3684, 9.6718,
      -3.9606, -3.1625 };

    xTrain[5] = new double[] { -2.0631, -1.5147,
      1.219, 0.44524 }; // forgeries
    xTrain[6] = new double[] { -4.4779, 7.3708,
      -0.31218, -6.7754 };
    xTrain[7] = new double[] { -3.8483, -12.8047,
      15.6824, -1.281 };
    xTrain[8] = new double[] { -2.2804, -0.30626,
      1.3347, 1.3763 };
    xTrain[9] = new double[] { -1.7582, 2.7397,
      -2.5323, -2.234 };

    int[] yTrain = new int[] { -1, -1, -1, -1, -1,
      1, 1, 1, 1, 1 }; // -1 = auth, 1 = forgery

    int maxIter = 100;
    double lr = 0.01;
    Console.WriteLine("Starting training");
    double[] wts =
      Train(xTrain, yTrain, lr, maxIter, 0);
    Console.WriteLine("Training complete");

    double acc = Accuracy(xTrain, yTrain, wts);
    Console.WriteLine("Accuracy = ");
    Console.WriteLine(acc.ToString("F4"));

    Console.WriteLine("Weights and bias: ");
    for (int i = 0; i < wts.Length; ++i)
      Console.Write(wts[i].PadLeft(8));
    Console.WriteLine("");

    Console.WriteLine("Note (0.00 2.00 -1.00 1.00)");
    double[] unknown = new double[] { 0.00, 2.00,
      -1.00, 1.00 };
    double z = ComputeOutput(unknown, wts);
    Console.WriteLine("Computed output = ");
    Console.WriteLine(z);  // -1 or +1

    Console.WriteLine("End perceptron demo ");
    Console.ReadLine();
  } // Main

  static int ComputeOutput(double[] x,
    double[] wts) { . . }

  static double[] Train(double[][] xData,
    int[] yData, double lr, int maxEpochs,
    int seed) { . . }

  static void Shuffle(int[] indices,
    Random rnd) { . . }

  static double Accuracy(double[][] xData,
    int[] yData, double[] wts) { . . }

  } // Program class
} // ns
All of the program logic is contained in the Main method. The demo uses a static method approach rather than an
OOP approach for simplicity. All normal error checking has been removed to keep the main ideas as clear as
possible.
The demo begins by setting up the training data:
double[][] xTrain = new double[10][];
xTrain[0] = new double[] { 3.6216, 8.6661,
  -2.8073, -0.44699 };
. . .

int[] yTrain = new int[] { -1, -1, -1, -1, -1,
  1, 1, 1, 1, 1 };
The predictor values are hard-coded and stored into an array-of-arrays style matrix. The class labels are stored
in a single integer array. In a non-demo scenario you'd likely want to store your training data as a text file:
  3.6216, 8.6661, -2.8073, -0.44699, -1
  4.5459, 8.1674, -2.4586, -1.4621, -1
  . . .
  -1.7582, 2.7397, -2.5323, -2.234, 1
And then you'd read the training data into memory using helper functions along the lines of:
double[][] xTrain = MatLoad("..\\data.txt",
  new int[] { 0, 1, 2, 3 }, ",");
int[] yTrain = VecLoad("..\\data.txt", 4, ",");
In many scenarios you'd want to set aside some of your source data as a test dataset. After training you'd
compute the prediction accuracy of the model on the held-out dataset. This accuracy metric would be a rough
estimate of the accuracy you could expect on new, previously unseen data.
After setting up the training data, the demo program trains the model using these statements:
int maxIter = 100;
double lr = 0.01;
Console.WriteLine("Starting training");
double[] wts = Train(xTrain, yTrain,
  lr, maxIter, 0);
The maxIter variable holds the number of training iterations to perform and the lr variable holds the learning
rate. Both of these values are hyperparameters that must be determined using trial and error. The learning rate
influences how much the weights and bias change on each training iteration.
The 0 argument passed to the Train() function is the seed value for a Random object that is used to scramble the
order in which training items are processed. The Train() function returns an array that holds the weights and
the bias, which essentially defines the perceptron classification model.
After training, the demo program computes the model's accuracy on the training data, and then displays the
values of the weights and bias:
double acc = Accuracy(xTrain, yTrain, wts);
Console.WriteLine(acc.ToString("F4"));

Console.WriteLine("\nModel weights and bias: ");
for (int i = 0; i < wts.Length; ++i)
  Console.Write(wts[i].ToString("F4").PadLeft(8));
Console.WriteLine("");
The demo concludes by making a prediction for a new banknote item:
double[] unknown =
  new double[] { 0.00, 2.00, -1.00, 1.00 };
double z = ComputeOutput(unknown, wts);
Console.WriteLine("Computed output = ");
Console.WriteLine(z);
The Accuracy() function computes the number of correct and incorrect predictions on the training data. Because
the training data has five authentic and five forgery items, just by guessing either class you would get 50 percent
accuracy. Therefore the 60 percent accuracy of the demo model isn't very strong and in a non-demo scenario you'd likely
next try a more powerful approach such as logistic regression, k-nearest neighbors, numeric naive Bayes, or a
neural network.
Computing Output
The ComputeOutput() function is very simple:
static int ComputeOutput(double[] x, double[] wts)
{
  double z = 0.0;
  for (int i = 0; i < x.Length; ++i)
    z += x[i] * wts[i];
  z += wts[wts.Length - 1];  // add the bias

  if (z < 0.0) return -1;
  else return +1;
}
Exactly how to store the bias value is a design choice. The demo program stores the bias in the last cell of the
weights array. Two alternatives are to pass the bias as a separate parameter, or to store the bias in the first
cell of the weights array. All three designs are common so if you're using a library implementation you'll have
to look at the source code to see which approach is being used.
The ComputeOutput() function returns -1 or +1 depending on the sign of the sum of products term. Rather
inexplicably, some references, including Wikipedia, apply the Signum() function on the sum of products term.
This returns -1, 0 (if the sum is exactly 0), or +1. This approach is incorrect. For perceptron classification,
a sum of products of 0.0 must be arbitrarily associated to either class -1 or class +1. The demo associates a
sum of exactly 0.0 to class +1.
Training a Perceptron Model
The Train() function is presented in Listing 2. The demo program uses a variation of perceptron training
called average perceptron. The key statements for both basic perceptron training and average perceptron training
are:
  int output = ComputeOutput(xData[i], wts);
  int target = yData[i];  // -1 or +1
  if (output != target) {
    double delta = target - output;
    for (int j = 0; j < n; ++j)
    wts[j] = wts[j] +
      (lr * delta * xData[i][j]);
    wts[n] = wts[n] + (lr * delta * 1);
  }
For each training item, the computed output using the current eights and bias values will be either -1 or +1.
The correct target value will be -1 or +1. If the computed output and the target values are the same, the
predicted class is correct and the weights and bias are not adjusted.
If the computed and target are different, the difference between the two values will be either -2 or +2. Each
weight and the bias is adjusted to make the computed output value closer to the target output value by adding or
subtracting the learning rate times the delta, times the associated predictor input value. The sign of the input
value controls the direction of the change in the associated weight, and larger input value produce a larger
change in weight. Very clever!
Listing 2. Perceptron Train Function
static double[] Train(double[][] xData,
  int[] yData, double lr, int maxIter,
  int seed)
{
  int N = xData.Length; // num items
  int n = xData[0].Length; // num predictors
  double[] wts = new double[n + 1]; // for bias
  double[] accWts = new double[n + 1];
  double[] avgWts = new double[n + 1];

  int[] indices = new int[N];
  Random rnd = new Random(seed);
  int iter = 0;
  int numAccums = 0;

  while (iter  <  maxIter)
  {
    Shuffle(indices, rnd);
    foreach (int i in indices)
    {
      int output = ComputeOutput(xData[i], wts);
      int target = yData[i];  // -1 or +1

      if (output != target)
      {
        double delta = target - output;
        for (int j = 0; j  <  n; ++j)
          wts[j] = wts[j] +
            (lr * delta * xData[i][j]);
        wts[n] = wts[n] + (lr * delta * 1);
      }

    for (int j = 0; j  <  wts.Length; ++j)
      accWts[j] += wts[j];
    ++numAccums;
  } // for each item

  ++iter;
  } // while epoch

  for (int j = 0; j  <  wts.Length; ++j)
    avgWts[j] = accWts[j] / numAccums;

  return avgWts;
} // Train
The average perceptron training technique accumulates each weight value on each training iteration. Then, when
the training iterations complete, then function returns the average weight and bias values. The idea is that
weights that produce a correct output result are retained in a sense, rather than being discarded.
The averaging technique usually produces a slightly better model than the basic non-averaging technique.
However, if you have a very large dataset the accumulated sum could overflow. In such situations you can compute
a rolling average, m, using the equation m(k) = m(k-1) + [ (x(k) – m(k-1)) / k ] where m(k) is the mean for the
kth value and x(k) is the kth value.
The Train() function processes the data items in a random order on each pass through the training dataset. This
helps prevent an oscillation where the weight updates due to one item are immediately undone by the next item.
The demo program scrambles the order of the training items using a program-defined function Shuffle():
static void Shuffle(int[] indices, Random rnd)
{
  int n = indices.Length;
  for (int i = 0; i < n; ++i) {
    int ri = rnd.Next(i, n);
      int tmp = indices[ri];
      indices[ri] = indices[i];
      indices[i] = tmp;
  }
}
The Shuffle() function uses the Fisher-Yates algorithm, which is one of the most common techniques in machine
learning. The function accepts a Random object. An alternative design is to define and use a static class-scope
Random object.
Computing Model Accuracy
Function Accuracy() computes the percentage of correct predictions made by a model with specified weights and
bias values. The function definition is presented in Listing 3. The function walks through each training
item's predictor values, uses the predictors to compute a -1 or +1 output value, and fetches the corresponding
target -1 or +1 value. If the computed value and target value are the same then the prediction is correct,
otherwise the prediction is wrong.
Listing 3. Perceptron Accuracy Function
static double Accuracy(double[][] xData,
  int[] yData, double[] wts)
{
  int numCorrect = 0; int numWrong = 0;
  int N = xData.Length;
  for (int i = 0; i < N; ++i)  // each item
  {
    double[] x = xData[i];
    int target = yData[i];
    int computed = ComputeOutput(x, wts);
    if (target == 1 && computed == 1 ||
      target == -1 && computed == -1)
    {
       ++numCorrect;
    }
    else
    {
       ++numWrong;
    }
  }
  return (1.0 * numCorrect) /
    (numCorrect + numWrong);
}
The demo code checks if both target and computed values are 1, or if both are -1. This approach is used to make
it explicit that -1 and +1 are the only two possible output values. A more efficient approach is simply to check
if the computed value equals the target value.
If you're familiar with other machine learning classification techniques, such as logistic regression, you might
wonder about computing an error metric. Computing error for perceptron classification isn't feasible because the
outputs are discrete. A computed output value prediction is either correct or incorrect. Put another way, for
perceptron classification, accuracy and error are essentially the same metric.
Wrapping Up
In practice, perceptron classification should be used rarely. Although perceptron classification is simple and
elegant, logistic regression is only slightly more complex and usually gives better results. Some of my
colleagues have asked me why averaged perceptron classification is part of the new ML.NET library. As it turns
out, averaged perceptron was the first classifier algorithm implemented in the predecessor to ML.NET library, an
internal Microsoft library from Microsoft Research named TMSN, which was later renamed to TLC. The averaged
perceptron classifier was implemented first because it is so simple. The average perceptron classifier was
retained from version to version, not because of its practical value, but because removing it would require
quite a bit of effort.
About the Author
Dr. James McCaffrey directs the data science and research efforts at Quaetrix, a data analytics company located near Redmond, Washington. Before joining Quaetrix, James was a senior research engineer at Microsoft. James can be reached at [email protected].