The Data Science Lab
How to Compute Disorder for Machine Learning Decision Trees Using C#
Using a decision tree classifier from a machine learning library is often awkward because it usually must be customized and library decision trees have many complex supporting functions, says resident data scientist Dr. James McCaffrey, so when he needs a decision tree classifier, he always creates one from scratch. Here's how.
A decision tree classifier is a machine learning (ML) prediction system that generates rules such as "IF age < 42.0 AND height >= 71.0 THEN jobType = 3." Using a decision tree classifier from an ML library is often very awkward because in most situations the classifier must be customized and library decision trees have many complex supporting functions. When I need a decision tree classifier, I always create one from scratch.
Implementing a decision tree classifier from scratch involves two main tasks. First, you must write functions related to repeatedly splitting your training data into smaller and smaller subsets based on the amount of disorder in the subsets. Second, you must write code that uses the splitting functions to create a tree data structure that computes a predicted class for a given input. In this article I explain how to compute disorder and split data. In the next Data Science Lab column I'll explain how to use the splitting and disorder code to create a working decision tree classifier.
A good way to see where this article is headed is to take a look at the screenshot of a demo program in Figure 1. The demo begins by computing and displaying a measure of disorder for two sets of class labels. There are many measures of disorder. The two most common for decision trees are Shannon entropy and Gini impurity. Both are quite similar. The demo program uses Gini impurity.
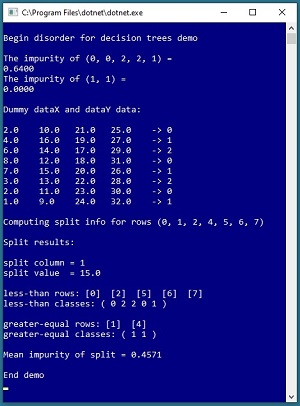 [Click on image for larger view.] Figure 1: Splitting a Dataset Based on Gini Impurity
The first example set of class labels is (0, 0, 2, 2, 1) and its impurity is 0.6400. The second set of labels is (1, 1) and its impurity is 0.0000. The more disorder there is in a set of items, the larger the impurity value. A set of items with a low amount of disorder has a small impurity value. In the extreme, a set of identical items (which has no disorder) has impurity = 0. For decision trees, smaller disorder is better.
Next, the demo program simulates the splitting of a full decision tree classifier. The demo sets up eight dummy items. Each item has four predictor values. Each item has one of three class labels, encoded as 0, 1 or 2.
When constructing a decision tree system, you start with all the items in a set of training data and then you repeatedly break the items down into smaller and smaller subsets. Therefore, when computing disorder you must specify which rows of the full training data you are currently analyzing. The demo specifies that the current rows to split are (0, 1, 2, 4, 5, 6, 7) -- in other words, all rows except row [3].
After calling the splitting function, the demo program displays the results of the split. The goal is to find two subsets of the source data so that the average impurity value of the two subsets is small. Exactly how this works is the main topic of this article and will be explained shortly. The demo program determined that the source dataset should be split into rows (0, 2, 5, 6, 7) and rows (1, 4). Doing so generates two subsets that have an average impurity value of 0.4571. Notice that row [3] is not used.
This article assumes you have intermediate or better skill with C# but doesn't assume you know anything about Gini impurity or Shannon entropy. The complete code for the demo program shown in Figure 1 is presented in this article. The code is also available in the file download that accompanies this article.
Understanding Gini Impurity and Shannon Entropy
Suppose you have five items and each of the items can be one of three classes. If the five items are (0, 0, 2, 2, 1) then Gini impurity is calculated as:
= 1 – [ (2/5)^2 + (2/5)^2 + (1/5)^2 ]
= 1 – [ 4/25 + 4/25 + 1/25 ]
= 1 – [ 9/25 ]
= 16/25
= 0.64.
In words, Gini impurity is 1 minus the sum of the squared probabilities of each class. Expressed as a math equation, Gini impurity is 1 – Sum[ p(i)^2 ] where the p(i) are the probabilities of each class. Notice that if all items in a set are the same class, then the probability of that class is 1.0 and the probabilities of all other classes are 0 and so Gini impurity is 1 – 1.0^2 = 0.0. Also notice that the order of items in a set does not affect the impurity value.
The maximum value of Gini impurity depends on how many classes there are in a set, but approaches arbitrarily close to 1.0 as the disorder increases. For example, if you have eight items where each item can be one of four different classes, a set of (0, 0, 1, 1, 2, 2, 3, 3) has maximum impurity and is calculated as:
= 1 – [ (1/4)^2 + (1/4)^2 + (1/4)^2 + (1/4)^2 ]
= 1 – [ 1/16 + 1/16 + 1/16 + 1/16 ]
= 1 – 4/16
= 0.7500
If you had 10 items and they were all different, impurity would be 1 – [ (1/10)^2 + (1/10)^2 + . . + (1/10)^2 ] = 1 – 10/100 = 0.9000.
Shannon entropy is calculated as minus 1 times the sum of the probability of each class times the log to base 2 of the probability. Expressed as an equation, Shannon entropy is -1 * Sum[ p(i) * log2(p(i)) ].
For a set of (0, 0, 2, 2, 1), Shannon entropy is calculated as:
= -1 * [ (2/5) * log2(2/5) + (2/5) * log2(2/5) + (1/5) * log2(1/5) ]
= -1 * [ (0.4 * -0.5288) + (0.4 * -0.5288) + (0.2 * -0.4644) ]
= 1.5219.
If all items in a set are the same, then the value of Shannon entropy is 0.0. The maximum value of Shannon entropy depends on the number of classes and equals log2 of the number of classes. For example, if you had 10 items and they were all different, Shannon entropy is log2(10) = 3.3219.
When creating a decision tree classifier, you must split a set of items into two parts so that the average disorder is small. In most cases the two subsets will have different sizes so it's standard practice to compute a weighted average. For example, suppose a first set of class values is (0, 0, 0, 1, 1, 2) and a second set is (0, 0, 1, 2). The Gini impurity of the first set with six items is 0.6111. The impurity of the second set with four items is 0.6250. The weighted average of the two sets is computed as:
= (6/10) * 0.6111 + (4/10) * 0.6250
= 0.6167
Why are there two different metrics for disorder for decision tree classifiers? Years ago, when decision tree classifiers were first being investigated by researchers, it was not known if different measures of disorder would have an effect or not. As it turns out, the choice of disorder metric makes little or no difference in most scenarios. Because Gini impurity is a bit easier to compute, it's slightly more common than Shannon entropy.
The Demo Program
To create the demo program, I launched Visual Studio 2019. I used the Community (free) edition but any relatively recent version of Visual Studio will work fine. From the main Visual Studio start window I selected the "Create a new project" option. Next, I selected C# from the Language dropdown control and Console from the Project Type dropdown, and then picked the "Console App (.NET Core)" item.
The code presented in this article will run as a .NET Core console application or as a .NET Framework application. Many of the newer Microsoft technologies, such as the ML.NET code library, specifically target .NET Core so it makes sense to develop most C# ML code in that environment.
I entered "Disorder" as the Project Name, specified C:\VSM on my local machine as the Location (you can use any convenient directory), and checked the "Place solution and project in the same directory" box.
After the template code loaded into Visual Studio, at the top of the editor window I removed all using statements to unneeded namespaces, leaving just the reference to the top-level System namespace. Then I added a reference to the Collections.Generic namespace because the demo code uses the List<int> collection type. The demo needs no other assemblies and uses no external code libraries.
In the Solution Explorer window, I renamed file Program.cs to the more descriptive DisorderProgram.cs and then in the editor window I renamed class Program to class DisorderProgram to match the file name. The structure of the demo program, with a few minor edits to save space, is shown in Listing 1.
Listing 1. Disorder for Decision Trees Demo Program Structure
using System;
using System.Collections.Generic;
namespace Disorder
{
  class DisorderProgram
  {
    static void Main(string[] args)
    {
      Console.WriteLine("Begin disorder demo ");

      int[] items1 = new int[] { 0, 0, 2, 2, 1 };
      double impurity1 = Impurity(items1,
        new List<int>(){ 0, 1, 2, 3, 4 }, 3);
      Console.WriteLine("Impurity (0, 0, 2, 2, 1) = ");
      Console.WriteLine(impurity1.ToString("F4"));

      int[] items2 = new int[] { 1, 1 };
      double impurity2 = Impurity(items2,
        new List<int>() { 0, 1 }, 3);
      Console.WriteLine("Impurity of (1, 1) = ");
      Console.WriteLine(impurity2.ToString("F4"));

      double[][] dataX = new double[8][];
      dataX[0] = new double[] { 2.0, 10.0, 21.0, 25.0 };
      dataX[1] = new double[] { 4.0, 16.0, 19.0, 27.0 };
      dataX[2] = new double[] { 6.0, 14.0, 17.0, 29.0 };
      dataX[3] = new double[] { 8.0, 12.0, 18.0, 31.0 };
      dataX[4] = new double[] { 7.0, 15.0, 20.0, 26.0 };
      dataX[5] = new double[] { 3.0, 13.0, 22.0, 28.0 };
      dataX[6] = new double[] { 2.0, 11.0, 23.0, 30.0 };
      dataX[7] = new double[] { 1.0, 9.0, 24.0, 32.0 };

      int[] dataY = new int[8] { 0,1,2,0,1,2,0,1 };

      Console.WriteLine("Dummy dataX dataY data: ");
      ShowData(dataX, dataY);

      Console.Write("Computing split info for rows ");
      Console.WriteLine("(0, 1, 2, 4, 5, 6, 7)");

      List<int> srcRows =
        new List<int>() { 0, 1, 2, 4, 5, 6, 7 };
      SplitInfo si = GetSplitInfo(dataX, dataY,
        srcRows, 3);

      Console.WriteLine("Split results: ");
      Console.WriteLine("split column = " +
        si.splitCol);
      Console.WriteLine("split value  = " +
        si.splitVal.ToString("F1"));

      Console.Write("less-than rows: ");
      ShowList(si.lessRows);
      Console.Write("less-than classes: ");
      ShowClasses(dataY, si.lessRows);

      Console.Write("greater-equal rows: ");
      ShowList(si.greaterRows);
      Console.Write("greater-equal classes: ");
      ShowClasses(dataY, si.greaterRows);

      Console.WriteLine("Mean impurity of split = " +
        si.meanImpurity.ToString("F4"));

      Console.WriteLine("End demo");
      Console.ReadLine();
    } // Main

    static double Impurity(int[] dataY,
      List<int> rows, int numClasses) { . . }

    static double MeanImpurity(int[] dataY,
      List<int> rows1, List<int> rows2,
      int numClasses) { . . }

    static SplitInfo GetSplitInfo(double[][] dataX,
      int[] dataY, List<int> rows,
      int numClasses) { . . }

    static void ShowData(double[][] dataX,
      int[] dataY) { . . }

    static void ShowList(List<int> lst) { . . }

    static void ShowClasses(int[] dataY,
      List<int> rows) { . . }

  } // Program class

  class SplitInfo
  {
    public int splitCol;
    public double splitVal;
    public List<int> lessRows;
    public List<int> greaterRows;
    public double meanImpurity;
  }
}
All of the program logic is contained in the Main method. The key function is GetSplitInfo() which analyzes specified rows of a dataset and returns five values stored in a program-defined SplitInfo class. Function GetSplitInfo() uses helper function MeanImpurity() which calls helper function Impurity(). The demo program uses three display helper functions, ShowData(), ShowList(), and ShowClasses().
Getting Split Information from a Dataset
The diagram in Figure 2 illustrates how function GetSplitInfo() works. The source data has eight items, each with four values and an associated class label. The function traverses the 8 * 4 = 32 predictor values (but skips over the four values in row [3]). For each value, the data is split into two subsets and the mean impurity of the two subsets is computed. The function keeps track of the best split values (smallest mean impurity) and returns those values.
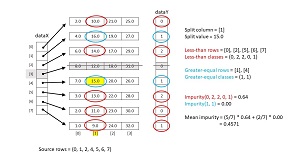 [Click on image for larger view.] Figure 2: Algorithm for Splitting a Dataset Based on Impurity Disorder
Function GetSplitInfo() traverses the data from left to right, top to bottom: 2.0, 10.0, 21.0, . . 32.0. Suppose the current value is v = 15.0 as shown in Figure 2. The function scans the current column, [1], from top to bottom and stores the rows where the value is strictly less than v in one list, and the rows where the value is greater than or equal to v in a second list. In this example the less-than values are 10.0, 14.0, 13.0, 11.0, 9.0 in rows (0, 2, 5, 6, 7). The greater-than-or-equal values are 16.0 and 15.0 in rows (1, 4).
After generating a proposed split, function GetSplitInfo() computes the mean impurity of the split. If the current split is better than the best split seen so far, the current split column, split value, split rows, and split mean impurity are saved.
The algorithm used by GetSplitInfo() finds a good split but doesn't necessarily find the best possible split because in most situations there are just too many possible subsets. For example, even if there are only n = 100 items, there are 633,825,300,114,114,700,748,351,602,687 ways to split the items into two subsets.
Function GetSplitInfo() and helpers MeanImpurity() and Impurity() are presented in Listing 2. The functions are implemented as static methods for simplicity and have no error checking to keep the main ideas as clear as possible.
Listing 2. Function GetSplitInfo() and Its Disorder Helpers
static SplitInfo GetSplitInfo(double[][] dataX,
  int[] dataY, List<int> rows, int numClasses)
{
  // given a set of source rows, find the col and value
  // and less-rows and greater-rows of split that gives
  // lowest resulting mean impurity (or entropy)

  int nCols = dataX[0].Length;
  SplitInfo result = new SplitInfo();

  int bestSplitCol = 0;
  double bestSplitVal = 0.0;
  double bestImpurity = double.MaxValue;
  List<int> bestLessRows = new List<int>();
  List<int> bestGreaterRows = new List<int>();

  foreach (int i in rows)  // traverse data
  {
    for (int j = 0; j < nCols; ++j)
    {
      double splitVal = dataX[i][j];  // curr value
      List<int> lessRows = new List<int>();
      List<int> greaterRows = new List<int>();
      foreach (int ii in rows)  // walk curr column
      {
        if (dataX[ii][j] < splitVal)
          lessRows.Add(ii);
        else
          greaterRows.Add(ii);
      } // ii

      double meanImp = MeanImpurity(dataY, lessRows,
        greaterRows, numClasses);

      if (meanImp < bestImpurity)
      {
        bestImpurity = meanImp;
        bestSplitCol = j;
        bestSplitVal = splitVal;

        bestLessRows = new List<int>(lessRows);
        bestGreaterRows = new List<int>(greaterRows);
      }

    } // j
  } // i

  result.splitCol = bestSplitCol;
  result.splitVal = bestSplitVal;
  result.lessRows = new List<int>(bestLessRows);
  result.greaterRows = new List<int>(bestGreaterRows);
  result.meanImpurity = bestImpurity;

  return result;
}

static double Impurity(int[] dataY, List<int> rows,
  int numClasses)
{
  // Gini impurity
  // dataY is all Y (class) values
  // rows tells which ones to analyze

  if (rows.Count == 0) return 0.0;

  int[] counts = new int[numClasses];  // each class
  double[] probs = new double[numClasses];
  for (int i = 0; i < rows.Count; ++i)
  {
    int idx = rows[i];  // pts into dataY
    int c = dataY[idx];  // class
    ++counts[c];
  }

  for (int c = 0; c < numClasses; ++c)
    if (counts[c] == 0) probs[c] = 0.0;
    else probs[c] = (counts[c] * 1.0) / rows.Count;

  double sum = 0.0;
  for (int c = 0; c < numClasses; ++c)
    sum += probs[c] * probs[c];

  return 1.0 - sum;
}

static double MeanImpurity(int[] dataY,
  List<int> rows1, List<int> rows2, int numClasses)
{
  if (rows1.Count == 0 && rows2.Count == 0)
    return 0.0;

  double imp1 = Impurity(dataY, rows1, numClasses);
  double imp2 = Impurity(dataY, rows2, numClasses);
  int count1 = rows1.Count;
  int count2 = rows2.Count;
  double wt1 = (count1 * 1.0) / (count1 + count2);
  double wt2 = (count2 * 1.0) / (count1 + count2);
  double result = (wt1 * imp1) + (wt2 * imp2);
  return result;
}
If you want to experiment with Shannon entropy in place of Gini impurity, you can create a function named Entropy() by modifying the code in function Impurity() to:
double result = 0.0;
for (int c = 0; c < numClasses; ++c) {
  if (probs[c] == 0.0)
    result += 0.0;
  else
    result += probs[c] * Math.Log(probs[c], 2.0);
}
return -1.0 * result;
Notice that because the log to any base of 0 is negative infinity you must branch around that condition.
The Display Helper Functions
For sake of completeness, the three display functions in the demo program are presented in Listing 3. This code isn't part of the core disorder-split functionality and is useful mostly for debugging purposes.
Listing 3. The Display Helper Functions
static void ShowData(double[][] dataX, int[] dataY)
{
  for (int i = 0; i < dataX.Length; ++i)
  {
    for (int j = 0; j < dataX[0].Length; ++j) {
      Console.Write(dataX[i][j].ToString("F1").
        PadRight(7));
    }
    Console.Write(" -> ");
    Console.WriteLine(dataY[i]);
  }
}

static void ShowList(List<int> lst)
{
  for (int i = 0; i < lst.Count; ++i)
    Console.Write("[" + lst[i] + "]  ");
  Console.WriteLine("");
}

static void ShowClasses(int[] dataY, List<int> rows)
{
  Console.Write("( ");
  for (int i = 0; i < rows.Count; ++i)
  {
    int row = rows[i];
    int cls = dataY[row];
    Console.Write(cls + " ");
  }
  Console.WriteLine(")");
}
Wrapping Up
Even though decision tree classifiers are conceptually among the simplest of all ML systems, they're quite tricky to implement. Based on my experience, many developers have trouble with decision tree classifiers because they fail to appreciate the need to fully understand the disorder and splitting mechanism before wading into the tree data structure part of the implementation.
In the next Visual Studio Magazine Data Science Lab column I'll show you how to use the ideas and code presented here to implement a completely customizable decision tree classifier from scratch using the C# language. Having decision tree classifier code is a valuable addition to your ML toolkit.