News

New JavaScript Debugger Now Default in VS Code 1.47 (June 2020 Release)

Oft-cited No. 1 development tool Visual Studio Code has a new debugger for the oft-cited No. 1 programming language, JavaScript.

Having been offered in preview versions of Microsoft's popular open source, cross-platform code editor for months -- and as the default in last month's Insiders build -- it's now enabled by default in the June 2020 release (version 1.47), working with Node.js and Chrome.

The debugger's GitHub site lists "what's new" including:

  • Debug child process and workers
  • Debug Node.js processes in the terminal
  • Profiling support
  • Easy npm script debugging
  • Automatic browser debugging
  • Instrumentation breakpoints
  • Better autocompletion in debug console
  • Return value interception
  • Top-Level await
  • Pretty-print minified sources
  • Support for Microsoft Edge and WebView2
  • Better sourcemap and breakpoint behavior
  • Copy values in call stack view

Furthermore, this week's post announcing VS Code 1.47 lists:

  • Single file debugging: This provides functionality found in other debug extensions, with new icons in the title area indicating debugging can be kicked off with a button click.
  • If one or both of these icons show up on the left-hand side of the editor's title area, then running or debugging the file in the editor is just one click away.
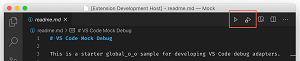
    [Click on image for larger view.] If one or both of these icons show up on the left-hand side of the editor's title area, then running or debugging the file in the editor is just one click away. (source: Microsoft).
  • Less cluttered CALL STACK view: This is achieved by hiding debug session nodes that exist for technical reasons, but do not provide much value to users.
  • New command alias Set Next Statement for Jump to Cursor: To make the command Jump to Cursor more discoverable for users coming from Visual Studio, the dev team added the command alias Set Next Statement.
  • Breakpoint Path on Hover: In the BREAKPOINTS view, hovering over a source breakpoint shows its absolute path.

Besides all that JavaScript debugging goodness, the June 2020 release of VS Code sees:

  • Accessibility improvements -- New screen reader capabilities: "Screen readers can now update the cursor offset in the editor. As a result, the screen reader 'Say All' command should work better when stopped and resumed."
  • Windows ARM builds -- Windows on ARM is now available in stable: This is pretty self-explanatory, and you can read more about it this GitHub issue and this Reddit conversation.
  • Source Control unified view -- All repositories displayed in a single view: Developers can now get a better overview of the entire workspace status. Also, devs can now move the Source Control view to the panel and move other views to the Source Control view container.
    All repositories are rendered in a single view to provide a better overview of the entire workspace status.
    [Click on image for larger view.] All repositories are rendered in a single view to provide a better overview of the entire workspace status. (source: Microsoft).
  • View and sort pending changes -- View files as a tree or list, sort by name, path, or status: Developers can sort changes in the source control view by name, path (default), and state with the list view option. The view options (list vs. tree) and sort options are consolidated into a new View & Sort menu item available in the context menu.
  • Edit complex settings -- Edit object settings from the Settings editor: "Before, the Settings editor could only be used to edit the settings of primitive types, like strings and booleans, and you needed to edit settings.json directly for more complicated settings types. Now, you can edit non-nested object settings from the Settings editor. Extension authors can use this functionality to increase the visibility of these kinds of settings."
  • New HexEditor extension -- Edit files in hexadecimal format from within VS Code: This functionality, providing for native hexadecimal editing in the editor, sees continued improvement including the ability to undo, redo, edit existing hex cells, add new cells to the end of the document), and large file optimization such that developers can now open files larger than 18 MB.
  • Notebook UI updates -- Improved UX and undo/redo support: Still in preview, a GitHub Issue Notebooks extension helps developers search GitHub issues and pull requests.
  • Remote Development tutorials -- Learn to develop over SSH, inside Containers, and in WSL: Specifically, these are:

    Other Remote Development functionality includes:

    • Remote -- SSH: Remote server can listen on a socket instead of a port.
    • Remote -- Containers: Prompt to open repository in a volume.
    • Remote -- Containers and WSL: More details are available in this WSL 2 blog post.
  • Java Pack Installer for macOS -- This sets developers up to develop in Java with VS Code on macOS: A new Visual Studio Code for Java Pack Installer (note: clicking on link may initiate download) automates the acquisition of dependencies and extensions for Java development on macOS. This was announced in last month's update to Java on Visual Studio Code.

All of the above and more is presented in greater detail in the announcement post.

About the Author

David Ramel is an editor and writer at Converge 360.

comments powered by Disqus

Featured

  • Mastering Blazor Authentication and Authorization

    At the Visual Studio Live! @ Microsoft HQ developer conference set for August, Rockford Lhotka will explain the ins and outs of authentication across Blazor Server, WebAssembly, and .NET MAUI Hybrid apps, and show how to use identity and claims to customize application behavior through fine-grained authorization.

  • Linear Support Vector Regression from Scratch Using C# with Evolutionary Training

    Dr. James McCaffrey from Microsoft Research presents a complete end-to-end demonstration of the linear support vector regression (linear SVR) technique, where the goal is to predict a single numeric value. A linear SVR model uses an unusual error/loss function and cannot be trained using standard simple techniques, and so evolutionary optimization training is used.

  • Low-Code Report Says AI Will Enhance, Not Replace DIY Dev Tools

    Along with replacing software developers and possibly killing humanity, advanced AI is seen by many as a death knell for the do-it-yourself, low-code/no-code tooling industry, but a new report belies that notion.

  • Vibe Coding with Latest Visual Studio Preview

    Microsoft's latest Visual Studio preview facilitates "vibe coding," where developers mainly use GitHub Copilot AI to do all the programming in accordance with spoken or typed instructions.

  • Steve Sanderson Previews AI App Dev: Small Models, Agents and a Blazor Voice Assistant

    Blazor creator Steve Sanderson presented a keynote at the recent NDC London 2025 conference where he previewed the future of .NET application development with smaller AI models and autonomous agents, along with showcasing a new Blazor voice assistant project demonstrating cutting-edge functionality.

Subscribe on YouTube