News
Microsoft Details Native Integration of Elastic on Azure
Microsoft detailed the native integration of Elastic tech with its Azure cloud computing platform, increasing application observability.
Specifically, Elastic application performance monitoring (APM) functionality is being integrated to allow for unified observability of Spring Boot applications in the Azure Spring Cloud. The integration means Microsoft Azure Spring Cloud logs and metrics data can be moved into Elastic for analysis, and apps can be monitored using the Elastic APM Java Agent and persistent storage with Azure Spring Cloud.
"Elastic can now seamlessly ingest logs and metrics from Microsoft Azure Spring Cloud so that DevOps and SREs can monitor their Spring Boot applications -- whether in the cloud, on-premises, or in hybrid environments -- and remove monitoring silos to increase operational efficiency and developer productivity," said Microsoft's Asir Selvasingh, principal PM architect, Java on Azure, in a Jan. 19 blog post. "DevOps and SREs can monitor both Spring Boot logs and application metrics across all environments by automatically shipping them to Elastic. Teams can also correlate and add context to their Spring data with other observability data sets across their environments for holistic end-to-end monitoring."
While the announcement post was just published last week, along with documentation for analyzing logs and monitoring apps, it was introduced last November in a video by Elastic.
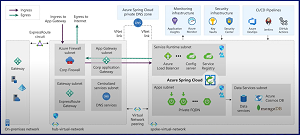 [Click on image for larger view.] Unified Observability for Spring Boot Apps Using Elastic (source: Elastic).
"Elastic is now natively integrated into Azure for users to deploy and seamlessly onboard data to Elastic," said Hemant Malik, a solutions architect at Elastic, in the video. "Using the diagnostic settings from your Azure Spring Cloud application, you can now easily ship the logs with a simple checkbox to elastic deployments on Azure. On the Elastic deployment you can visualize and analyze these logs in Kibana with out-of-the-box dashboards focused on Azure Spring Cloud data. You can drill down to specific applications and app instances. You can enable Elastic's APM Java agent to get app traces and metrics into Elastic."
Microsoft said the integration helps organizations that migrate on-premises Spring Boot applications to the Azure cloud and need to aggregate logs and metrics from such applications and instrument them for APM while using solutions with which their developers are familiar and may have been using for years. Also being served are organizations that must ensure continuity for existing server-side software implementations that are currently shipping logs and metrics and are pre-instrumented for end-to-end monitoring using systems like Elastic.
The new functionality also addresses a significant cloud migration challenge: end-to-end monitoring. As explained in a Visual Studio Magazine article last month, "Microsoft Report: Kubernetes Top Target for Cloud-Migrated Spring Apps," end-to-end monitoring was the No. 2 challenge facing migrators, reported by 24 percent of respondents to a survey (the top challenge was migrating associated databases, reported by 30 percent of respondents).
"App development, DevOps, infrastructure, and SRE teams benefit from monitoring and gaining an understanding of the performance of their cloud applications," the report said. "Observability and monitoring solutions collect and analyze a vast amount of data from app environments, most organizations empower all the teams, including SRE and infrastructure teams, to help business teams to gain insights into operational aspects of their business apps. This practice helps executives and business stakeholders to make data-driven business decisions."
One interesting benefit of the Elastic integration is the ability to use Elastic's built-in machine learning functionality to automatically detect anomalies.
"The Elastic Stack processes data upon ingestion, ensuring that you have the metadata you need to identify root causes or add context to any event," Selvasingh said. "Built-in tools like Data Visualizer help you find the jobs you're looking for and identify fields in your data that would pair well with machine learning. You can derive actionable insights from your logs and APM data with the rich alerting and anomaly detection capabilities within Elastic Observability."
Last week's post also details: shipping Azure Spring Cloud logs to Elastic; instrumenting Spring Boot applications; and analyzing Spring Boot application performance.
About the Author
David Ramel is an editor and writer at Converge 360.