Agile Advisor
Unleash the Power of Story Points
Story Points are a crucial aspect of agile development, as they help quantify workload and job estimates. If you're not using them, you're missing out.
Story Points is a very common practice in agile development, and even though it's not mentioned in the Scrum guide, many Scrum teams consider it a core practice.
Very simply, Story Points is way to estimate the size of an item on your backlog.
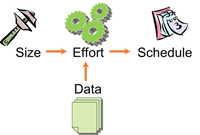
Estimating size is the first step in good estimation. Figure 1 shows how estimation should be done.
- Schedule is a function of the Effort (person-hours) required.
- Effort is a function of the Size of the backlog item. The bigger the item, the more effort required.
- Effort should be calculated using historical data. The past is the best predictor of the future.
[Click on image for larger view.] |
| Figure 1. Basic principles of estimation. |
Estimating the size of a software deliverable is not something to which many engineers are accustomed. Teams are often asked: "When will you get Feature X done?", and "How many hours will it take to complete Feature X"; rarely are they asked, "How big is Feature X"?
Learning to estimate size is the biggest paradigm shift teams need to make to get better at estimation. Estimating the size of software isn't a new problem: function points is an example of a sizing metric introduced in 1979, and other sizing methodologies have been tried over the years. The problem isn't that they weren't successful -- it's that they weren't accessible, being complicated and hard to understand.
Understanding Story Points isn't hard. Getting started and fully utilizing its power can be.
What is a Story Point?
The hardest part of getting started is defining what "five story points" even means. The team needs to create its own meaning for story points that is unique for them. This may feel daunting, but it doesn't have to be. To get started quickly, follow these steps:
- Find a number of representative backlog items the team has already completed.
- Get the team together and have the team decide on what an "average sized" backlog item is.
- Once you've picked that item, call it five story points. This is your "golden story".
- Celebrate, because you're done.
The golden story is your new reference point for all future estimations. Now when estimating a backlog item, the question is how it compares to the golden story. Is it a little smaller? Call it three story points. Is it a little bigger? Call it eight story points. Is it quite a bit bigger? Call it 13 or even 20 story points. Is it tiny? Call it one.
The key to success is to not get hung up on the need for precision. Software engineers love precision. That's a good thing, but we need to let go of that with estimation. Estimation is messy stuff, and investing in more and more precise estimates has a quickly-diminishing return. I believe that function points and the other sizing methodologies never hit mainstream because they pursued precision to the point where the methodology became too hard to use or understand.
Story points are not precise, by design. This is what makes them so approachable; but they can still be very powerful.
Velocity
The key power in assigning story points to items up front is to collect historical data, also known as velocity. Velocity is the number of story points the team completes in a given time period, typically a sprint.
Figure 2 shows a team that's completed four sprints. The numbers represent the total story points completed each sprint.

[Click on image for larger view.] |
| Figure 2. A team's past velocity. |
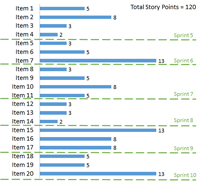
Velocity goes up and down with sprints, with an average of 20. This same team has about 20 items on its backlog that are story-pointed. The total story points for the remaining 20 items is 120 story points, as shown in Figure 3. It's fairly simple math to see that it will take your team about six more sprints to complete the 20 stories.
[Click on image for larger view.] |
| Figure 3. Estimating a schedule using historical data. |
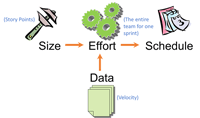
Figure 4 shows the application of the simple estimation formula: You're using size (story points) to calculate effort (the entire team working for a sprint), based on historical data (your velocity) to calculate schedule. This is very powerful stuff.
[Click on image for larger view.] |
| Figure 4. Applying the basic principles of estimation. |
It's powerful because maybe for the first time, you have actual data backing an estimate. Assume an executive says, "We need to get those 20 items done in three sprints, or we might as well all pack up our desks and go home". (Yes, I have actually had executives say that to me … a couple of times). Without historical data, it's very difficult to push back. But even with a few sprints of data, you can confidently say that three sprints isn't possible, and you'll more likely need six sprints.
Are these estimates precise? Not really. You don't know that it will take precisely take six sprints. It may take only five sprints, it make take seven. That's expected variability in any estimate. Most importantly, you have high confidence that it won't get done in three sprints. And you're able to keep your team from a death march towards an impossible goal.
Which Items to Story Point
A question that always comes up: which backlog items should be story pointed, and which ones shouldn't? For example, should the team story point bugs? Should it story point spikes? What about improvement items?
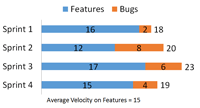
The answer's simple: Story point only the types of items on your product backlog. Assume the team in the example above decided to story point the bugs it fixed in a sprint. Figure 5 shows an example of that might look like.
[Click on image for larger view.] |
| Figure 5. A team estimating bugs with story points. |
On average, each sprint had five story points of work on bugs. This means your average velocity on new features is actually 15. Most backlogs don't have backlog items representing the bugs they expect to fix in the future. If the product backlog in Figure 3 represents new features, then using 20 as velocity won't give a good estimate -- instead, the team should be using 15. If the velocity's off by that much, it could result in the team convincing the executive it needs six sprints, when it will actually take eight.
Supposed the same team worked on a few spikes in those sprints, and they were story pointed as well. Figure 6 shows how this might look.
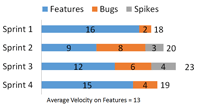
[Click on image for larger view.] |
| Figure 6. A team estimating spikes and bugs with story points. |
The team's velocity on features is actually 13, which compared to the 20 items on the backlogs means it would need more than nine sprints to complete them.
Process improvement items may or may not be on your backlog. If they are, they should be included in the story points counted towards velocity. If not, the team should leave them out.
To accurately use historical data to estimate the future, what the team counts towards their velocity must match what it's estimating in its backlog.
Teams that know how to use story points have a very powerful tool. Often, the question "When can we get this done?" comes with so much emotional baggage attached to it, that teams are forced into an impossible deadline. Armed with data, the team can bring logic back into those discussions; this is a very good thing, indeed.
About the Author
Gregg Boer is a Principal Program Manager at Microsoft with 25 years of experience in software. Over his career, Gregg has worked as a Project Manager, Program Manager, Requirements Lead, Software Engineer, Analyst, QA Lead, and Software Designer. Gregg joined Microsoft in 2005 because he believed in the vision of Team Foundation Server. Currently, Gregg is working on the team developing a set of world-class Agile Tools built on top of the TFS Platform.