Code Focused
Transforming Windows Files on C++: What's Fastest?
We just covered background information on our last file processing foray. Now, what's faster: CRT, Windows API, or something else?
- By Bartlomiej Filipek
- 03/06/2017
Last time, we looked at four implementations for transforming an input file into output using CRT, Standard C++ Library, Windows API and memory-mapped files. So, what's the fastest method? That's what well look at this time.
(For this article, I've posted the working files in a repository on GitHub here.)
The speed of IO is not easy to measure. Many different factors can influence our results: hardware characteristics, OS caches, API/app caches, the number of system calls. To start, let's do a simple test: Let's measure execution of our test application in a naive way using this command:
timep.exe WinFileTests_x64.exe transform crt test512.bin outCrt.bin 1024
This command will run our application ("WinFileTests_x64") that transforms test512.bin (512MB file) into outCrt.bin file. To do this, it uses the CRT API and a block of memory of 1024 bytes. The whole command is wrapped by timep, which is an application similar to time from Unix that shows user, kernel and the elapsed time of a given process. I've got it from a great book, Windows System Programming, by Johnson M. Hart (Addison-Wesley, October 2015).
Internally, the command uses GetProcessTimes to get the timings.
Here are the first set of results:
timep.exe WinFileTests_x64.exe transform crt test512.bin outCrt.bin 1024
Transformed 524288 blocks from test512.bin into outCrt.bin
Real Time: 00:00:01.604
User Time: 00:00:00.078
Sys Time:  00:00:00.375
And here's the second call:
Transformed 524288 blocks from test512.bin into outCrt.bin
Real Time: 00:00:00.831 << !! >>
User Time: 00:00:00.125
Sys Time:  00:00:00.703
So, what happened here? As you can see, the second invocation of the test took half of the time!
Let's run it on a larger file. Here are the initial results:
timep.exe WinFileTests_x64.exe transform crt test2048.bin outCrt.bin 1024
Transformed 2097152 blocks from test2048.bin into outCrt.bin
Real Time: 00:00:08.821
User Time: 00:00:00.562
Sys Time:  00:00:03.437
And the results for the second time:
timep.exe WinFileTests_x64.exe transform crt test2048.bin outCrt.bin 1024
Transformed 2097152 blocks from test2048.bin into outCrt.bin
Real Time: 00:00:04.471
User Time: 00:00:00.343
Sys Time:  00:00:03.468
Just for kicks, I ran the results a third time, and got the same results as the second time.
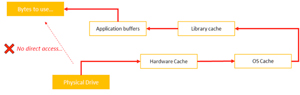
Do you know what causes such dramatic speed up from the first to the second result? It's likely one of the caches, as described in the diagram in Figure 1.
 [Click on image for larger view.]
Figure 1: Reading Bytes from a File, Simplified View
[Click on image for larger view.]
Figure 1: Reading Bytes from a File, Simplified View
Any file that is read might go into the OS cache, so that the next time the app is started the file access will be much faster. The OS tries to cache as many files as it needs to keep system robust.
Obviously, we'd like to start using the same start conditions for each of our test runs, which means caches are a bad thing when doing perf tests.
Instead, our task is to measure the speed of the application so that the behavior of the app and library caches are the same across different runs. So no work here; rather, the problem lies in the system cache and the hardware cache, since they are preserved between application invocations. We don't have much control over the hardware cache (at least it's not easy), but we can influence the system cache.
There might be several techniques to clear the cache of OS, even using some special tools (like RamMAP), but I've found that one of the easiest ways to do this on Windows is to open the file using the FILE_FLAG_NO_BUFFERING mode and then close the file. Windows removes that whole file from the cache, and it's exactly what we need here!
Let's compare results now:
WinFileTests_x64.exe clear test2048.bin << that clears the cache!

timep.exe WinFileTests_x64.exe transform crt test2048.bin outCrt.bin 1024
Transformed 2097152 blocks from test2048.bin into outCrt.bin
Real Time: 00:00:10.569
User Time: 00:00:00.250
Sys Time:  00:00:02.468
And the second run:
WinFileTests_x64.exe clear test2048.bin

timep.exe WinFileTests_x64.exe transform crt test2048.bin outCrt.bin 1024
Transformed 2097152 blocks from test2048.bin into outCrt.bin
Real Time: 00:00:09.859
User Time: 00:00:00.343
Sys Time:  00:00:02.984
There's a difference in running time, but it's not that much as before! We'll use this technique before running a test so at least we're sure the input files are not cached by OS.
Note that there's no need to clear output files, since we're opening them for writing, and they should be truncated from the start. I haven't observed any effects on having those files in the OS cache.
Additionally, it's good to take the following steps to avoid other effects:
-
Disable virus/malware scan for the time of the tests, or at least exclude benchmark test files from the scanning.
-
Disconnect from the network if possible.
- Limit the number of opened applications, ideally run only the benchmark application.
-
Decide if you want to run a benchmark on battery save mode or max performance? Probably max performance is the better choice, but it might depend on what you plan. When using power-saving mode you might expect bigger variance.
Setting a Benchmark
Let's set a benchmark, which we'll design in the following way:
-
We run the test application with given api name, input file, block size, and sequential option.
-
Each test is executed five times, and we take min, max and median value out of that. This is probably quite a small number of samples but should give a good estimate. If we want to have more details, we need to increase that number: maybe to even 100 (but that would make testing very long!)
- We test on different buffer sizes: 1KB, 16KB, 128KB, 1024KB and 2048KB.
- We can test different input files: 256MB, 512MB, 1024MB, 2048MB. (Note that it would be interesting to test a very large file that doesn't fit in completely in RAM, something line 10GB or even more.)
- The whole test runs 4 apis x 5 buf sizes x 5 invocations = 100 runs for a given file size on two separate machines: 1) i7 4720HQ with 12GB Ram, SSD and Windows 10 - referred as SSD in the tests; and 2) i5 4200U with 4GB Ram, HDD and Windows 8.1 - referred as HDD in the tests.
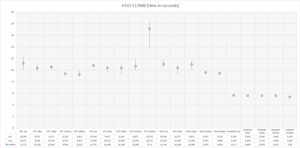
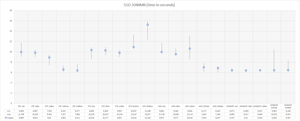
You can see the final results in the Excel file that I posted to GitHub here, with tests for different files. So that this article isn't long, I present only results for two files sizes: 256MB, 512MB on HDD (Figures 2 and 3) and 1024MB and 2048MB on SSD (Figures 4 and 5).
 [Click on image for larger view.]
Figure 2: 256MB HDD Results (Time In Seconds)
[Click on image for larger view.]
Figure 2: 256MB HDD Results (Time In Seconds)
 [Click on image for larger view.]
Figure 3: 512MB HDD Results (Time In Seconds)
[Click on image for larger view.]
Figure 3: 512MB HDD Results (Time In Seconds)
 [Click on image for larger view.]
Figure 4: 1024MB SSD Results (Time In Seconds)
[Click on image for larger view.]
Figure 4: 1024MB SSD Results (Time In Seconds)
 [Click on image for larger view.]
Figure 5: 2048MB SSD Results (Time In Seconds)
[Click on image for larger view.]
Figure 5: 2048MB SSD Results (Time In Seconds)
Here's what we see in those figures:
-
CRT and the standard Windows API method seems to give similar results; maybe the CRT is implemented as only a thin layer on top of WinApi?
- When you increase buffer size CRT, WinApi gives better performance.
- C++ library is the slowest; when increasing the buffer size, performance drops.
- Memory-mapped files are the fastest method to process a file. Logically, there's no difference when you increase the buffer size.
With the SSD Drive and a more powerful machine I could test larger files. The first thing you'll notice is the quite high volatility of the results when comparing SDD to HDD tests. I cannot explain why, but sometimes the SSD/OS drive took quite a long time to process a given command.
As well, we can see that the memory-mapped files provide the most consistent results and usually are fastest. Still, when you provide a large buffer, CRT and WindowsAPI results might be faster – interesting, if anything.
As for WindowsAPI and CRT results, they behave very similarly. And finally, we see that the Standard Library is, again, much worse and it doesn't help to increase the buffer size.
Well, That Was Fun...
Who's the winner of our tests? Memory-mapped files may be the most complicated to implement, but they give very decent performance and usually have the fastest processing. On my faster machine equipped with an SSD there's a chance to beat memory mapping by providing a large buffer for the CRT or using standard Windows method, but we're guessing at this point and that could be investigated further.
Let me know what you think about those tests. How could I improve the accuracy of the results? Have you done similar tests on your own? Let's hear it in the comments.
About the Author
Bartlomiej Filipek is a software developer in Poland who specializes in C++, Windows and graphics programming. He worked for a number of companies developing multimedia, document editors, games, graphics drivers and flight planning systems, and has taught game development at local university. Follow Bart's blog at http://www.bfilipek.com and on Twitter @fenbf.