Inside VSTS
Static Code Analysis in VS2010
Just because your code compiles when you press F5 in VS2010 doesn't mean it's error free. Use the static code analysis features of VS2010 to analyze managed assemblies.
Just because your code compiles when you press F5 in Visual Studio 2010, doesn't mean your code is error free. It just means your code compiles and runs on your machine. Run your code on a 64-bit machine or a machine configured in another language, and you could potentially run into issues that never occurred when you hit F5.
This is where static code analysis steps in to help you out. Code Analysis is used to analyze managed assemblies, and report any programming and design rule violations. These rules are based off the Microsoft .NET Framework Design Guidelines. There are over 200+ rules that ship with Visual Studio 2010, broken into different groups. These groups are then broken into different rule sets, which can be used to target specific coding issues. Code analysis is available in both Visual Studio 2010 Premium and Visual Studio 2010 Ultimate editions.
Running Code Analysis
Code analysis can be configured to run automatically every time your code is compiled. This can be every time you press F5 in the Visual Studio IDE, or as part of the automated build process using Team Build and Team Foundation Server 2010. You also have the option to run code analysis manually within the Visual Studio IDE, or as a check-in policy.
The results of running code analysis are displayed in the Error List window. By default, all code analysis rule violations are displayed as warnings, though this is configurable.
After running static code analysis, you will want to go through the results, to try and fix any problems that were found. Each violation displayed contains detailed information on the violation, as well as the code file and line number of the violation. You have the option to fix the violation or suppress the violation. Suppressing a violation is useful to indicate that a warning, in a particular case, is not applicable for this particular application.
A Simple Code Analysis Example
The best way to understand code analysis is to run through a simple example. This example is going to use a very simple Windows Form calculator application. This is a simple calculator, where you enter two numbers, click the appropriate button (Add, Subtract, Multiply, Divide) and the appropriate operation will run.
Before running code analysis over the code, we need to set which code analysis rules we want to run. This is set as a project setting. Right-click the SimpleCalculator1 project in Solution Explorer, and select Properties from the context menu. This opens a tab where all the different project properties can be configured. Click the Code Analysis tab to configure code analysis for this project, as shown in Figure 1.
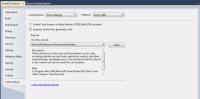
[Click on image for larger view.] |
| Figure 1. |
We will explain more about the options in this window in a future article. For now, select the Microsoft All Rules rule set in the drop down box, then select File -> Save to save your changes to the project properties.
To run code analysis, right-click on the project in Solution Explorer, and select Run Code Analysis from the context menu. You can also select the Analyze menu in Visual Studio, and then select Run Code Analysis for SimpleCalculator1. The project will be compiled, and code analysis will be run against it. The results of the analysis are shown in Figure 2.
There were 20 code analysis violations initially found. Scanning through the violations, most of them are globalization warnings. These warnings are letting me know of areas of my code that would be problems when running the code on computers encoded to a different language.
Let's look at Warning #4, which is on line 21 of Form1.cs. This warning is telling me I should change the Convert.ToInt32 call at line 21 of my code to include the IFormatProvider parameter, so the code will know what to do based off the culture configured on the computer.
To fix this particular problem, we are going to specify CultureInfo.InvariantCulture during any of our conversion processes. Figure 3 shows the original code that produced Warning #4.
To fix this problem, we have to add a using statement to the top of the file for System.Globalization. Next, we need to add CultureInfo.InvariantCulture to the first Convert.ToInt32() call, as shown in Figure 5
Now if we re-run code analysis against the code, we only have 19 warnings displayed, as we have just fixed one. At this point, we would continue to work our way through the code analysis warnings until we have either fixed them all, or suppressed any warnings that do not apply.
Conclusion
In this column we have scratched the surface with what you can do with code analysis. We discussed what code analysis is and why you would want to use it, and then provided a simple example of code analysis. Future articles will delved into configuring different code analysis options, as well as how to create your own custom code analysis rules.
Code analysis is a strong tool in your code arsenal that helps you find potential issues in your code that are not compile issues. Its integration into Visual Studio, as well as the ability to run during the automated build process, make this an easy to use tool for all developers.
About the Author
Mickey Gousset spends his days as a principal consultant for Infront Consulting Group. Gousset is lead author of "Professional Application Lifecycle Management with Visual Studio 2012" (Wrox, 2012) and frequents the speaker circuit singing the praises of ALM and DevOps. He also blogs at ALM Rocks!. Gousset is one of the original Team System/ALM MVPs and has held the award since 2005.