Inside VSTS
TFS 2010 and the SQL Server Analysis Services Cube
Jeff Levinson offers a tour of the new reporting cube functionality in Team Foundation Server 2010.
- By Jeff Levinson
- 06/03/2010
One of the most powerful features of Team Foundation Server (TFS) is the SQL Server Analysis Services (SSAS) cube that back TFS. Of all of the integrated tools available on the market, none that I know of is supported by a back end reporting cube. This cube is accessible through SQL Server Reporting Services (SSRS) and Microsoft Excel and even Microsoft's new add-in for Excel, Power Pivot.
In TFS 2010 the cube has changed significantly at the user interface level and some of the default measures. The usage is the same but this article looks at a tour of the new facets of the cube and how you can use it to make your own custom fields easier to find. This article will focus on the work item measures as they are the most used in reporting. If you have never reported off of the cube through Excel, then this article serves as a brief introduction on how to do this.
Figure 1 shows the Excel pivot table panel which is used for reporting off of the cube.
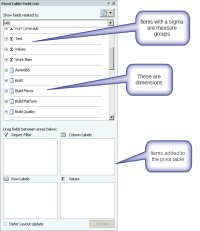
[Click on image for larger view.] |
| Figure 1.PivotTable panel. |
Looking specifically at the work items measures, there have been some big changes. The first change is that there are no Historical Work Item measures anymore. In fact, the only measures available to you for the work item are the following:
- Completed Work
- Original Estimate
- Remaining Work
- Revision Count
- State Change Count
- Story Points
- Work Item Count
You'll also notice there are no cumulative measures. This is one of the major changes -- the cube handles cumulative and historical values depending on how you do your queries. Simply the fact of using dates as one of the dimensions will pull the historical information. You will also note that on the Show fields related to drop down there are different items related to work items as compared with 2008. These areas are shown in Table 1.
Related Area |
Description |
Current Work Item |
The latest state of the work items -- not historical |
Linked Current Work Item |
The current state of work items linked to the selected work item. This view also allows you to filter your returned work items based on the link type -- this is where having custom link types allow you to report on data extremely easily. |
Linked Current Work Item Test Case |
The current state of test cases linked to the selected work item |
Work Item |
Work item and work item history |
Work Item Changeset |
Changesets related to work items over time |
Work Item to Category |
Breakdown of the work items by category (Bug, Requirement, Test Case, etc.) |
Work item to Tree |
Work items with a parent/child relationship -- shows rolled up data as well. An example is being able to roll up the completed work from all tasks that are children of requirements. Nice. |
Work Item with Result |
Work items with test results. In general this is specific to the Test Case work item type. |
Table 1 -- Work Item Related Fields
Of the Work Item related fields, only the Work Item fields selection allow access to the work item measures, although the measures report back accurately regardless of what items are selected. This is a major change from 2008. In 2008 it was possible to create pivots which could show invalid data -- in 2010 this possibility is greatly reduced because of the re-worked cube.
The structure of items in the pivot table field list has also changed -- and this has implications for you when customizing the process template. Figure 2 shows a view of the new change.
The core work item fields (and a few others) are shown in the root of any dimension, but other items are broken down into folders which match their reference name. For example, in the Microsoft.VSTS.Common "namespace" are items such as Microsoft.VSTS.Common.ActivatedBy or Microsoft.VSTS.Common.ActivatedDate. This means that when you are customizing the process template you can make it easier for users of the cube to find relevant data by using good naming conventions.
PowerPivot
A tool that I have been using recentlym which has been of great help when reporting on data in TFS, is PowerPivot. PowerPivot is a free add-in from Microsoft for Excel which allows for the processing of millions of rows of data quickly and easily. Better yet, it allows you to join data across data sources.
So take for example the fact that you may customize a work item to include a budget number and have the developers fill in hours spent in the work items. If you wanted to determine hours against a budget and see the budgetary information, you could use PowerPivot to take the data from TFS and pull the related budget information in one spreadsheet. You can perform pivots on the data, load it up to SharePoint 2010, add KPI's and other business intelligence functionality. PowerPivot can be downloaded from www.powerpivot.com.
About the Author
Jeff Levinson is the Application Lifecycle Management practice lead for Northwest Cadence specializing in process and methodology. He is the co-author of "Pro Visual Studio Team System with Database Professionals" (Apress 2007), the author of "Building Client/Server Applications with VB.NET" (Apress 2003) and has written numerous articles. He is an MCAD, MCSD, MCDBA, MCT and is a Team System MVP. He has a Masters in Software Engineering from Carnegie Mellon University and is a former Solutions Design and Integration Architect for The Boeing Company. You can reach him at [email protected].