In-Depth
Load Testing with Custom Performance Counters
Tracking down performance problems in your application can be a frustrating experience. Reduce your stress levels with custom counters.
- By Benjamin Day
- 10/02/2012
What happens on the typical load-testing project? For me, the projects tend to fall into one of two buckets. Bucket No. 1: We've got a problem. Bucket No. 2: We've got a performance penalty clause in our contract and we want to make sure we don't have any problems. In the first one, you're trying to reproduce and then diagnose a known performance problem. In the second, you're trying to verify the performance requirements of the application; when you find a performance problem, you fix it. In both models, you're staring at performance problems and you need to get them resolved.
The first step is to be able to reliably recreate those performance problems; this is where Visual Studio 2012 load-testing features come in. A Visual Studio 2012 load test can generate a lot of simulated user traffic against your application. These load tests are composed of Web Performance Tests (WPTs) and unit tests.
WPTs simulate a user performing a set of actions against an HTTP-based Web application. Unit tests are chunks of C# or Visual Basic .NET code that plug into the Visual Studio 2012 testing framework. When you're load testing a Web application, the majority of the tests will be WPTs, rather than unit tests. If you're load testing SQL queries or a service-oriented app, you'll probably have more unit tests. The idea is that the load tests will run WPTs and unit tests, and recreate the application's performance problems.
Creating the WPTs and unit tests that make up the load tests is fairly straightforward -- the difficult part is figuring out what's actually slow. The Visual Studio 2012 load-test framework provides tools to find these problems, but you can make it easier if you think about how to organize your tests.
The best practice is to organize your tests by user story (that is, "use case"). For example, you have two use cases to include in a load test: "administrator creates a new user" and "authenticated user submits a support ticket." There should be a WPT for each use case. When you run these tests as part of a load test, you'll get statistics about each of those use cases individually and (hopefully) be able to identify one or more slow use cases.
Is the Database Slow?
It's a little gift from the universe whenever you can identify individual slow use cases in your suite of WPTs. Unfortunately, you don't always receive that gift. A lot of times it's just generally slow. When I'm dealing with general slowness, my first instinct is to check for performance issues in the database code.
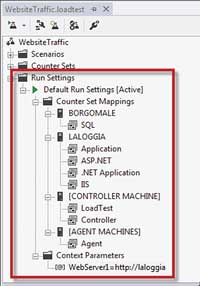
I'll do this by going to my load test and enabling SQL Tracing for the Run Settings. SQL Tracing uses the same technology as the SQL Server Profiler, and allows the load test to capture performance metrics about the individual SQL queries being executed against a SQL Server during test execution. The Run Settings (Figure 1) allow you to specify which servers to monitor as part of a test, in addition to numerous configuration values about the execution of the load test itself. These include the connection values for SQL Server Tracing.
[Click on image for larger view.] |
| Figure 1. The Run Settings for a load test. |
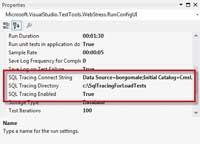
You can enable SQL Server Tracing for your Test Settings by clicking on the appropriate Test Settings node in the load test editor, then viewing the Properties window. The Properties window (see Figure 2) includes three values:
- SQL Tracing Enabled: A Boolean value that turns tracing on or off.
- SQL Tracing Connect String: Specifies which SQL Server to profile.
- SQL Tracing Directory: This is a little confusing. The SQL Profiler client doesn't require a directory, but when you run SQL Server Tracing as part of a load test, the Profiler output gets written to disk before the results are combined with the data from the rest of the load test. Therefore, when you enable Tracing for the first time, you'll need to create a directory on the SQL Server machine and give the load test Controller service account permissions to access this folder.
[Click on image for larger view.] |
| Figure 2. The SQL Server Tracing options for the Run Settings. |
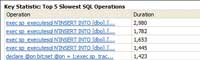
When running a load test after enabling SQL Server Tracing, you'll get a new section on your load test Summary that shows the top five slowest SQL operations (see Figure 3). Clicking on any of the links for the slow operations drills into the full details for that SQL command, and gives more insight into slow SQL operations.
[Click on image for larger view.] |
| Figure 3. The top five slowest SQL operations. |
This tracing functionality doesn't have any awareness of whether these commands are issued by your application, but this actually isn't a bad thing -- there's no guarantee that what's making your application slow is actually inside your application. There could be another application that's starving your application's access to SQL Server resources, for instance. Seeing this list of slow SQL commands gives you a place to start to tune your application either by reconfiguring SQL Server or modifying the stored procedures, queries and schemas of your application's database.
PerfMon Counters
Another helpful feature of the Visual Studio 2012 load-testing functionality is the ability to capture Windows Performance Monitor Counters (PerfMon Counters) as part of the load test. If an application uses PerfMon Counters, you can use that data to view real-time information about what's happening in that application. PerfMon Counters are used by Windows, the Microsoft .NET Framework, ASP.NET, IIS and virtually every other service application in the Microsoft stack.
You can configure which PerfMon Counters are captured by your load test, and for which servers, by editing the Run Settings for the test. Figure 1 shows a section of the Run Settings interface labeled "Counter Set Mappings." Under Counter Set Mappings, you can see that my test pulls SQL counters from a server named Borgomale (my database server), and pulls a number of different types of counters from LaLoggia (my Web server), including counters for ASP.NET, IIS and the .NET Framework.
By default, the load tests also capture information about the execution of the load test itself from the load test Controller machine, and any load test Agent machines. If you run your load tests using Visual Studio 2012 to generate the load, then the Controller and Agent will both be your local machine. There are limits to how much traffic you can generate when you run your load tests locally, so if you want to generate lots and lots of load, you'll want to create a load test "Rig" (for more information, see bit.ly/Oakdwr).
If you're running your load test using a load test Rig, the test will automatically know which servers are Controllers and which are Agents, and capture the appropriate performance counters and data from those servers. This data about the load-test execution helps determine if the slow performance is in your app, rather than some kind of problem generating or measuring the load itself.
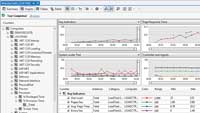
After executing the load tests, you can drill into the results and view the moment-by-moment values for the PerfMon Counters configured. Figure 4 shows the values that were captured as part of a test grouped by the server in the left column and also graphed in five-second intervals on the right. By examining these PerfMon values, you should be able to see where the bottlenecks are in your application.
[Click on image for larger view.] |
| Figure 4. Counters in the test results. |
Rolling Your Own
Unfortunately, you can sometimes capture SQL Server Tracing data and dozens of PerfMon Counters and still feel like you're just guessing at what the problem is. Actually, a lot of the time that's exactly what's going on. You're guessing because you really don't have a clue about what your application is really doing. You've got SQL Server Tracing data that might show you what pokey database calls your app's making, and you've got PerfMon Counters for Windows, the .NET Framework and IIS; but these are just telling you what's happening around your application. What you really need is for your application to expose its own PerfMon Counters.
In my experience, it's rare to find a customer who's created their own PerfMon Counters in their apps. I'm guilty, too: In the 10 years or so before I started working with the Visual Studio load-testing tools, I'd written zillions of lines of C# but not a single custom PerfMon Counter. When you're doing load testing, having your application tell you where it's choking is unbelievably helpful.
A customer once asked me: "If we don't add in performance counters, are we wasting our time?" My answer was "Yes," because trying to guess what's wrong and then try to tune for it is amazingly inefficient. It's not only inefficient; you could also be wasting your effort by tuning something that has absolutely zero to do with the issue. If you have your own counters, you know exactly what's going wrong and (probably) as you tune the application, you can (hopefully) watch those counter values change in the right direction.
What Do We Need and How Do We Do It?
For load testing, I'm usually looking for the same three values across a bunch of different operations in the application. If the application is an online document management system, I'll probably have high-level operations like "Create Document," "Update Document," "View Document Versions" and "Subscribe to Change Notification." For each of these operations, I'll definitely want to know how many operations have been processed, how many operations per second and the average duration for each operation.
I think a lot of developers don't use custom counters because it feels like a lot of tedious and repetitive work. Well, they're right. It can be tedious (if you do it wrong), but object-oriented programming can really help out. To help, I created a class called OperationPerformanceCounterManager.
When creating an instance of this class, you give it a Performance Monitor Category Name and an operation name. OperationPerformanceCounterManager takes those two pieces of data and handles all the rest of the logic for creating and managing the performance counters that track how many operations have been processed, how many operations per second and the average duration for each operation.
Listing 1 is an example of how you might use OperationPerformanceCounterManager in your application. The DocumentManager class performs an operation you'd like to track, called "Create Document."
In the constructor, DocumentManager creates an instance of OperationPerformanceCounterManager for the "Create Document" operation. Later on, when the CreateDocument(string) method is called, it first puts the current time in ticks in a variable and then performs the work that it's supposed to do.
After that work's complete, it gets the number of elapsed ticks since the start of the operation and passes that information to the OperationPerformanceCounterManager's RecordOperation method. Inside of the RecordOperation method, the OperationPerformanceCounterManager will update the three performance counters for the operation: "Create Document: Average Operation Time," "Create Document: Operation Count" and "Create Document: Operations Per Second."
This same pattern's repeated in all other places you need instrumentation. OperationPerformanceCounterManager lets you do this with a minimal amount of code and very little code duplication. I've found that if I create a Singleton class that contains all the instances of my application's OperationPerformanceCounterManager, I can cut down on the duplication and clutter even further. Listing 2 uses a class called DataAccessCounterLocator to call RecordOperation on an operation called "Save Web Page." DataAccessCounterLocator contains all the variables for the operations in the data-access layer for an application, and exposes them as properties.
Include Custom Counters in the Load Tests
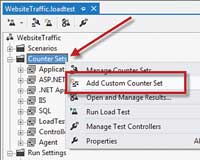
Once you've added your custom PerfMon Counters to your application and installed those counters on the appropriate servers, the last task is to add them to your load tests. Open your load test, right-click on the Counter Sets node and choose Add Custom Counter Set, as shown in Figure 5 This creates a new counter set, named Custom1 by default. Right-click on the Custom1 counter set and choose Add Counters.
[Click on image for larger view.] |
| Figure 5. Add a custom counter set. |
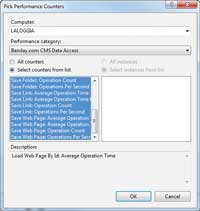
You'll then see a dialog named Pick Performance Counters that lets you read and import your custom performance counters from your servers. Figure 6 shows the process of importing the Benday.com CMS Data Access performance counters from a server named LALOGGIA. For this dialog, enter the server name, choose the performance counter category, select the counters you want to import and click OK.
[Click on image for larger view.] |
| Figure 6. Importing the custom counters. |
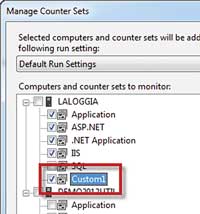
The next step is to right-click on the Run Settings for your test and choose Manage Counter Sets. On the Manage Counter Sets dialog (see Figure 7), you'll enable the capture for the Custom1 counter set for the relevant servers, then click OK.
[Click on image for larger view.] |
| Figure 7. The Manage Counter Sets dialog. |
Now that you've enabled custom counters, run the load test. When it's done, you'll find that all your custom counters have been recorded, along with the rest of the performance counters and the SQL Tracing information.
Don't Be a Mind Reader
Visual Studio 2012 load tests are immensely helpful for surfacing performance problems in your applications. Out of the box, load tests provide an easy way to access performance monitor data about the servers that run your app, and how your app's interacting with the .NET Framework and SQL Server.
With minor tweaking of the Run Settings, you can easily enable SQL Server Tracing to find underperforming database queries. This gives you a lot of information with which to diagnose your performance problems; but if you really want to get serious about analyzing your application, take a little time to add some custom performance counters. Don't try to read your application's mind about what's going wrong -- add performance counters to the code and then ask what's wrong.