News
VS Code Gets Java Debugger
Visual Studio Code is getting more Java programming functionality in a new extension from Microsoft that adds debugging capabilities.
We earlier reported that, in view of the lack of support for Java in the Visual Studio IDE, Java jockeys have been using VS Code with extensions such as Language Support for Java by Red Hat, which has been downloaded more than 1 million times.
In marking the one-year anniversary of the tool -- which is still in preview status -- earlier this week, Red Hat mentioned an upcoming debugger "from our friends," providing no further information.
It turns out, "our friends" referred to Microsoft, as just a day later, Microsoft announced Java Debugger for Visual Studio Code
"For Java developers on Visual Studio Code, the Language Support for Java by Red Hat extension has been great for providing language features such as IntelliSense and project support," Microsoft's Xiaokai He said in a blog post yesterday. "At the same time, we've also heard feedback that users would also like Java debugging."
That feedback resulted in the new, "lightweight" debugger extension based on the company's Java Debug Server.
Features of the new Microsoft debugger extension as listed by the company for this initial release include:
- Launch/Attach -- You can either launch the Java project within VS Code or attach to any running JVM process in debug mode, locally or remotely.
- Breakpoints -- Conditional breakpoints by Expressions and Hit are supported and can easily be set using the inline breakpoint settings window. This allows you to conveniently add conditional breakpoints to your code, directly in the source viewer, without requiring a modal window. Break on exceptions is also supported.
- Control flow -- Including Pause, Continue F5, Step over F10, Step into F11, Step out Shift+F11.
- Data inspection -- When you're stopped at a breakpoint, the debugger has access to the variable names and values that are currently stored in memory. Inspect/Watch/Set Variables are supported.
- Diagnostics -- The CALL STACK panel shows the call stack of your program and allows you to navigate through the call path of each captured allocation. Multi-threaded debugging is supported by parallel stacks.
- Debug Console -- The Debug Console lets you see information from both stdout and stderr.
Microsoft also bundled its new debugger extension with Red Hat's extension to create the Java Extension Pack now available in the Visual Studio Marketplace.
Using the new debugger entails opening up a Java project -- via Maven, Gradle or Eclipse -- and then opening a Java file to activate the extensions, along with adding debug configurations to the launch.json file.
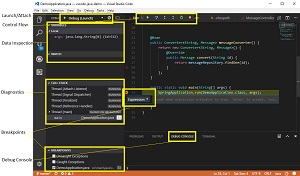 [Click on image for larger view.] Using the VS Code Java Debugger (source: Microsoft).
On the Reddit social programming site, reaction to the news was mixed.
On the negative side, one developer said: "I've toyed with VSCode for my day to day Java development. The main thing that is stopping me from adopting it currently is how slow the Language Support by Red Hat extension is. For small Spring Boot applications it can be adequate, but for medium to large multi-module code bases, it's not usable in its current state."
On the positive side, one developer said: "Day-to-day, I use 3 languages at work, with stuff like yaml/json/xml files on top of that. It's mainly JS, for which VSCode is ideal for me, but occasionally some Java too. Having an IDE that can deal with the occasional drop into another language is very helpful, and saves me having to open a complete new IDE just to work on one or 2 files."
On the Visual Studio Marketplace, the newly published extension has been installed 756 times as of this writing, earning a perfect 5.0 rating from three reviewers.
Note that other debugging tools can be found on the marketplace, too, such as "Java Debug" from DSnake (nearly 40,000 downloads) and "Java Debugger" by Don Jaymanne (some 171,000 download).
More information on using Microsoft's new debugger can be found in the company's "Java in VS Code" post.
Note that although Microsoft said that both the Java debugger and Java Debug Server would be open sourced shortly after their releases, a supplied GitHub link for the latter didn't work at the time of this writing (and multiple search engines couldn't find it anywhere), and no "Java Debugger for Visual Studio Code" entry could be found on GitHub.
About the Author
David Ramel is an editor and writer at Converge 360.