News
Microsoft Updates Java Debugger for VS Code
Microsoft updated the open source Java debugger for Visual Studio Code, adding support for Java 9 among other improvements.
The Java debugger -- an extension in the VS Code Marketplace -- was published by Microsoft a couple months ago and then open sourced last month.
As Java 9 was released after the debut of the Java debugger, the VS Code team has been building in support for it, among other enhancements in the new version 0.3.0.
"To allow more and more developers to try the new version of Java with VS Code, we’ve also updated the debugger to automatically detect modular project and then resolve module path as well as main class accordingly," said Xiaokai He, program manager, in a blog post Friday. "You can now launch your Java 9 application with breakpoint in your source file with VS Code."
Other improvements include the ability to run and debug a single Java file that isn't part of any VS Code project, which He said is useful for learning Java or writing utilities.
It's now also easier to configure workspace folder and environment variables in the launch.json file.
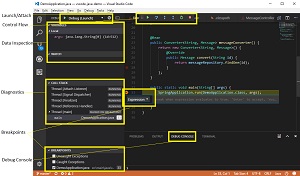 [Click on image for larger view.] Using the VS Code Java Debugger (source: Microsoft).
"Future work, He said, includes support for Junit test cases and multi-root workspaces, expression evaluation, and hot code replacing. General multi-root workspace support was just provided in the latest VS Code 1.18 release. It was the No. 1 requested feature of VS Code developers who make their wants known in GitHub issues with the "feature" label.
The debugger can be acquired in the Java Extension Pack -- which bundles the tool with the Language Support for Java by Red Hat extension (required) -- or as a standalone extension for developers who already have the Red Hat extension is already installed.
The extension pack has been installed some 87,000 times while the standalone debugger has been installed about 126,000 times. The Red Hat Java support extension has been installed nearly 1.6 million time.
Capabilities of the standalone debugger as described by Microsoft include:
- Launch/Attach
- Breakpoints
- Exceptions
- Pause & Continue
- Step In/Out/Over
- Variables
- Callstacks
- Threads
- Debug console
About the Author
David Ramel is an editor and writer at Converge 360.