News
With Java 19, VS Code Now Does Virtual Threads While Debugging
The latest update to Java on Visual Studio Code improves the debugging experience thanks to support for the newly released Java 19.
Java 19 shipped a month ago with a preview of Virtual Threads and Structured Concurrency thanks to Project Loom, the backing tech responsible for one of many debugging improvements in the October 2022 update. Microsoft's Java on VS Code dev team is responsible for the Extension Pack for Java on Visual Studio Code in the editor's marketplace, which sports 15.5 million installs.
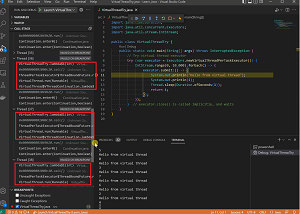
"Java 19 brings the first preview of virtual threads to the Java platform; This is the primary deliverable of Project Loom," Microsoft said in an Oct. 21 blog post. "Virtual threads are designed to significantly boost the scalability of concurrent Java programming while making little change to the current API. In our September release, we have enabled the support for virtual threads in our Java debugger. Note that you will need to install JDK 19 to use this feature."
 [Click on image for larger view.] Virtual Threads (source: Microsoft).
More about this feature is available in Oracle's Java Magazine article, "Coming to Java 19: Virtual threads and platform threads."
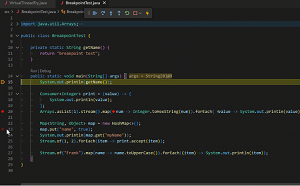
Debugging in Java on VS Code is further improved with new functionality that provides a visual indicator for inline breakpoints in a line of code like this:
Stream.of("Frank").map(name -> name.toUpperCase()).forEach((item -> System.out.println(item));
"Now when you set a breakpoint on this line, Visual Studio Code will automatically identify the lambda expressions in this line, and visualize them with grey dots," Microsoft said. "If you want to further set inline breakpoints on those lambda expressions, you can directly click on those grey dots, and the grey dots will turn into red dots like normal breakpoints, then the debugger will stop at these breakpoints during the code execution. This will provide you much easier debugging experience for these lambda expressions."
That new functionality is demonstrated in this animated GIF:
 [Click on image for larger, animated GIF view.] Inline Breakpoints in Animated Action (source: Microsoft).
Along with enhancing debugging, the dev team also implemented some code editing improvements concerning convenient Lombok operations when a user clicks on the Code Action lightbulb that triggers Quick Fixes.
Project Lombok, which received full support in the July 2022 update to Microsoft's Java on VS Code extensions, is designed to reduce boilerplate code, the amount of which is historically notorious in many Java projects. Lombok uses annotations for this task in order to streamline things like coding getters and setters.
The dev team's Code Action tweak effectively enables developers to "Lombok" their code, Microsoft said, or "DeLombok" the annotations they don't want anymore by deselecting them.
And, speaking of annotations, in yet another improvement the team enhanced its code analysis capabilities by adding support for @Nullable and @Nonnull annotations. Those annotations inform the developer and compiler if it's okay to allow null for a variable, parameter or return value, Microsoft said.
About the Author
David Ramel is an editor and writer at Converge 360.