News
The Rise of OpenTelemetry in Microsoft Dev Tooling
OpenTelemetry's rise from cloud native instrumentation project to broadly supported observability standard reached a new milestone this week as the Cloud Native Computing Foundation announced the project's graduation.
The graduation comes alongside recent updates across developer tooling, application monitoring and cloud observability services, including the .NET CLI, Visual Studio Code agents, Azure Monitor, Azure Functions, Amazon CloudWatch, Google Cloud Observability, Datadog and Grafana.
OpenTelemetry is an observability framework and toolkit for generating, exporting and collecting telemetry data such as traces, metrics and logs. The project documentation describes it as open source and vendor- and tool-agnostic, with the backend storage and frontend visualization intentionally left to other tools. It standardizes how applications emit operational data without requiring teams to commit to a single observability backend.
CNCF Graduation Marks a Maturity Milestone
The Cloud Native Computing Foundation announced OpenTelemetry's graduation on May 21, 2026, describing the project as a vendor-neutral, open source observability framework designed to standardize the collection, processing and exporting of metrics, logs and traces. CNCF said the project was formed in 2019 as a merger of OpenTracing and OpenCensus to address overlapping approaches to instrumentation and telemetry export.
CNCF reported that OpenTelemetry has more than 12,000 contributors from more than 2,800 companies. It also said OpenTelemetry has achieved the second-highest project velocity among more than 240 projects in the cloud native ecosystem, behind Kubernetes. CNCF listed Alibaba, Anthropic, Bloomberg, Capital One, eBay, FICO Software and Heroku among organizations that rely on OpenTelemetry to monitor and secure systems.
The graduation announcement also connected OpenTelemetry's growth to AI workloads. CNCF said adoption is gaining new interest as a layer to observe performance, reliability, accuracy and trustworthiness in AI workloads. The same announcement said the OpenTelemetry JavaScript API package was downloaded more than 1.36 billion times in the past 12 months, while the OpenTelemetry Python API package surpassed 1.3 billion downloads, with both packages setting new monthly download records in April 2026.
Microsoft Adds OpenTelemetry Across .NET, VS Code and Azure
Recent Microsoft updates provide several examples of OpenTelemetry becoming part of first-party tooling and services. In .NET 11 Preview 4 SDK release notes, Microsoft said the dotnet CLI now uses OpenTelemetry with Azure Monitor and OTLP exporters for opt-in telemetry, replacing the previous Microsoft.ApplicationInsights dependency. The release notes state that user-facing behavior is unchanged, including the DOTNET_CLI_TELEMETRY_OPTOUT opt-out mechanism, and that the change was motivated by NativeAOT work because Microsoft.ApplicationInsights was not AOT-friendly.
Visual Studio Code 1.121 also added an OpenTelemetry-related observability path for AI coding agents. The release notes say that, in collaboration with the Azure Managed Grafana team, there is now a prebuilt Azure Managed Grafana dashboard for OpenTelemetry signals emitted by agents in VS Code. The dashboard is described as visualizing agent operations, token usage, chat sessions, tool calls, per-model response time and time to first token.
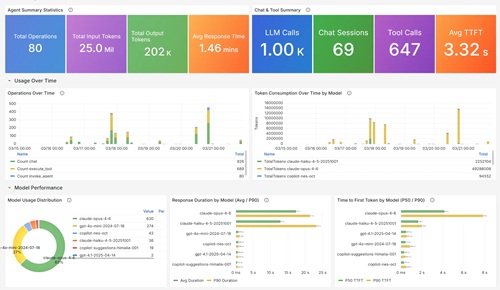 [Click on image for larger view.] Grafana Copilot Dashboard (source: Microsoft).
Microsoft's Azure Monitor documentation shows broader platform support for OpenTelemetry. The Application Insights OpenTelemetry guidance describes the Azure Monitor OpenTelemetry Distro as Microsoft's distribution of the open source CNCF observability standard, optimized for Azure Monitor. The documentation lists support for .NET, Node.js, Python and Java applications and says the distro enables automatic telemetry collection for traces, metrics, logs and exceptions.
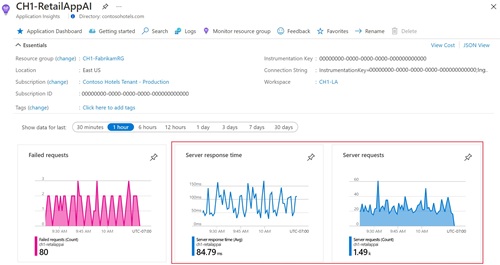 [Click on image for larger view.] .NET Telemetry in Application Insights (source: Microsoft).
Microsoft documentation also states that Azure Monitor now supports native ingestion of OpenTelemetry Protocol signals, allowing telemetry to be sent directly from OpenTelemetry-instrumented applications to Azure Monitor. That capability is in preview and includes three documented paths: OpenTelemetry Collector, Azure Monitor Agent and an Azure Kubernetes Service add-on.
For Kubernetes workloads, Microsoft documents preview support for monitoring AKS applications by using OTLP for instrumentation and data collection. For serverless workloads, Azure Functions documentation demonstrates OpenTelemetry support for distributed tracing across multiple function calls, using Application Insights and OpenTelemetry support with an Azure Developer CLI template.
Microsoft's Application Insights for .NET repository also shows OpenTelemetry's role in existing observability products. The repository README says the SDK now uses OpenTelemetry as the underlying telemetry collection framework with Azure Monitor Exporter for transmission. A breaking-changes document for Application Insights 2.x to 3.x describes version 3.x as a fundamental architectural shift from a custom telemetry pipeline to OpenTelemetry with Azure Monitor Exporter as the backend.
Cloud Providers and Observability Vendors Add Support
Outside Microsoft, recent official documentation and announcements show similar movement. AWS announced on April 2, 2026, that Amazon CloudWatch supports native OpenTelemetry metrics in public preview, allowing users to send metrics directly using OTLP without custom conversion logic or additional tooling. AWS also announced CloudWatch Container Insights with OpenTelemetry metrics for Amazon EKS in public preview, collecting metrics from open source and AWS collectors and sending them to CloudWatch using OTLP.
Google Cloud announced in September 2025 that Cloud Trace supports OTLP through telemetry.googleapis.com. In February 2026, Google Cloud said Cloud Monitoring supports OTLP for metrics, allowing metric data generated with OpenTelemetry SDKs and processed by the OpenTelemetry Collector to be sent directly to Cloud Monitoring in OpenTelemetry format. Google Cloud documentation also describes a Google-built OpenTelemetry Collector that collects OTLP traces, metrics and logs and exports that data to Google Cloud Observability and other backends.
Google Cloud's AI tooling documentation extends the pattern into agent development. Documentation for the Agent Development Kit states that ADK framework versions 1.17.0 and later include built-in support for OpenTelemetry and sending OpenTelemetry telemetry data to Google Cloud Observability.
Datadog and Grafana also document OpenTelemetry ingestion paths. Datadog's OTLP ingestion documentation says the Datadog Agent can ingest OTLP traces and metrics through gRPC or HTTP beginning with Agent versions 6.32.0 and 7.32.0, and OTLP logs beginning with versions 6.48.0 and 7.48.0. Grafana Labs' OpenTelemetry documentation says it supports OpenTelemetry as a core part of its observability strategy and provides paths to instrument applications, build data pipelines and send OTLP data to Grafana Cloud or self-managed Grafana backends.
OpenTelemetry Standardizes Telemetry Paths
The documented trend is not that OpenTelemetry replaces observability platforms. The project documentation explicitly says OpenTelemetry is not an observability backend. Instead, its role is to standardize instrumentation and telemetry movement across languages, frameworks and infrastructure. That distinction explains why Microsoft, AWS, Google Cloud, Datadog and Grafana can all support the same framework while continuing to offer different analysis, storage and visualization products.
The common thread across the updates is native support for OpenTelemetry Protocol and OpenTelemetry-based instrumentation. In Microsoft's ecosystem, recent examples span the command-line interface, application monitoring, Kubernetes, serverless functions and AI coding agent observability. In the broader industry, current documentation and announcements show OTLP support becoming a common ingestion path across major observability services.
OpenTelemetry gives teams a common set of APIs, SDKs, semantic conventions, collectors and protocols for telemetry data while allowing that data to flow to different backends. As more platforms support OpenTelemetry natively, teams have more documented paths to instrument applications once and route telemetry to the tools they already use.
About the Author
David Ramel is an editor and writer at Converge 360.